


This page covers the marketing metric; a currency conversion rate, the value of one currency in another, is a different thing.
What does a conversion rate divide by?
The base decides what a conversion rate means. When I read one, I first ask what it divides by. Four common definitions:
| Rate | Numerator | Denominator (the base) |
|---|---|---|
| GA4 session key event rate | Sessions in which a key event happened | All sessions |
| GA4 user key event rate | Users who performed a key event | All users |
| Google Ads conversion rate | Conversions | Ad interactions |
| Popup lead conversion rate | Submissions with an email or phone number | Popup displays |
The two GA4 rows come from Google's Analytics dimensions and metrics reference. Google Ads defines conversion rate as the average number of conversions per ad interaction, shown as a percentage, and notes that it can pass 100% when you count every conversion or track several actions.
Across the popups we power, between January 2024 and September 2026, we measured the last row:
This popup lead rate is NOT comparable with a website or ecommerce conversion rate. It counts leads, not orders; it divides by popup displays, not sessions or visitors; and it comes from lead-collecting popups, not whole websites.
How do you calculate conversion rate?
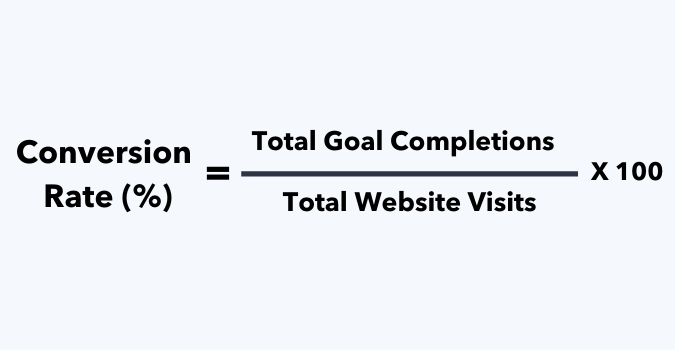
Conversion rate = (conversions ÷ base) × 100. The image uses website visits as the base; any base works if you count it and the conversions over the same period.
A hypothetical website example. If there are 100 visitors on your website, but 20 visitors are going to buy your product, then the conversion rate will be: (20/100) × 100% = 20%.
A popup illustration of the same formula. A popup displayed 10,000 times that collects 83 leads converts (83 ÷ 10,000) × 100 = 0.83% of its displays, the level of the benchmark median above. These numbers show the arithmetic, not a real campaign.
Popupsmart's video on the same definition:
What counts as a conversion?
A conversion is any completed action you decide matters: an order, a signup, a booked demo, a form submission. In Universal Analytics, the previous version of Google Analytics, conversions meant achieving goals, and a goal could be set up in the form of an ordered product or a newsletter subscription. Three distinctions change how you read the rate:
- Macro vs micro conversions. Google's Universal Analytics glossary describes a macro conversion as typically a completed purchase. A micro conversion, such as an email signup, shows the user moving toward one.
- Session-based vs user-based. A visitor who comes three times and buys once is one converting session out of three, but one converting user out of one.
- Form completion rate. Form submissions divided by the people who saw or started the form: the same metric with a narrow base. A popup lead rate is one version of it. To raise it, see how to increase form conversion rates.
Click-through rate is a neighbor, not a synonym: it divides clicks by impressions, and a click is usually a step toward the conversion.
Why segment a conversion rate?
This conversion rate can relate to all site visitors as well as segmented ones. It allows you to view the conversion rate per traffic source, device or page.
What moves a popup's conversion rate (median campaign)
| Segment | What we measured |
|---|---|
| Device | On mobile the median popup converts 1.02% vs 0.57% on desktop |
| Audience | Popups targeted at new visitors only convert 1.13% vs 0.77% for popups shown to everyone |
| Page type | Popups on cart and checkout pages convert 4.57% vs 1.07% on the home page (median campaign); blog pages convert 0.23% |
Popupsmart reports views, interactions, leads and conversion rate, broken down by country, referrer, page, device, browser and screen resolution. When I review a popup, I split its rate by device and page before I change the design.
How is conversion rate tracked in Google Analytics and Google Ads?
GA4 reports it as a key event rate; Google Ads reports conversions per ad interaction. The naming changed on March 27, 2024, when Google's Analytics release notes announced that events measuring actions important to your business "are now called 'key events'", while a "conversion" now refers to an action you use to measure ad campaigns and optimize bidding.
To read the rate in GA4:
- Mark the event as a key event. In Admin, under Data display, click Events and select the star next to the event, as in Google's key event setup steps. Marking doesn't change historic data.
- Open the acquisition reports. Google added Session key event rate and User key event rate to the default Traffic acquisition and User acquisition reports on June 12, 2024, according to the same release notes.
What is a good conversion rate?
A good conversion rate is one that beats your own earlier rate on the same base. No single figure fits, because each rate divides by something different. I compare a rate with its own history on the same base before I hold it against anyone else's benchmark.
For outside reference points, see what a good average website conversion rate is and what a good landing page conversion rate is. For popups, use the tiers in the By the Numbers box above, never a website figure.
How do you improve your conversion rate?
Just like the searchability of a site can be optimized, it is also possible to optimize the conversion. The fewer obstacles in the way to a goal, the more people will complete that goal.
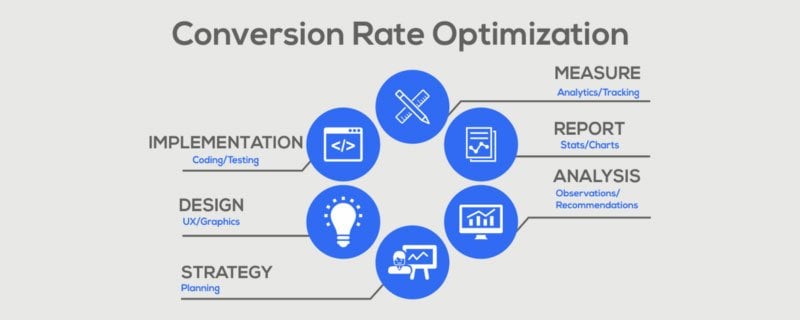
Start with the segment where the rate is weakest and change one thing at a time. When I try to raise a rate, I run an A/B split test so I can tell which change moved it. Popupsmart runs A/B split tests on design, audience and trigger variations, from the Advanced plan up.
If you want to increase conversion rates, our detailed guide about conversion rate optimization covers the whole process. For a store, see how to increase conversion rate on Shopify.