 ChatGPT
 Perplexity
 Claude
 Grok
Grok Google AI Mode
I wrote the first version of this post in October 2025, and it said the opposite, using a 2025 dataset whose definitions we couldn't reproduce when we rebuilt Popupsmart's benchmark. This edition answers the mobile vs desktop popup question with the 2026 benchmark (January 2024 – September 2026), where a lead is a popup submission containing an email address or phone number and every rate divides by popup displays. The update log at the end lists what changed.
Think about it. A mobile visitor scrolling during lunch break interacts in bursts—fast swipes, short attention, limited screen space. A desktop user, on the other hand, might be researching products with multiple tabs open, comparing options, and reading reviews. Both are valuable, but they respond to different kinds of friction and timing.
Mobile vs desktop popups: what the 2026 data shows
On popups, mobile is ahead on both leads and clicks, and it accounts for most popup displays. Each rate below is the median campaign, divided by popup displays on that device.
| Metric (median campaign, January 2024 – September 2026) | Mobile | Desktop |
|---|---|---|
| Lead conversion rate: email or phone leads ÷ popup displays | 1.02% | 0.57% |
| Click rate: clicks ÷ popup displays | 2.99% | 1.34% |
| Share of all popup displays | 63% | Not reported separately |
For a device-neutral reference point: across 3,034 Popupsmart popups that ask for an email or phone number (January 2024 – September 2026, each with at least 1,000 displays and 14 active days), the median converts 0.83% of its displays into leads; the top 25% reach 1.96% and the top 10% reach 3.87%. The median popup records a click on 2.25% of its displays, and the top 10% reach 11.67% (10,768 campaigns).
Because these are medians, one very large account can't drag them. Because they divide by displays, they tell you how often a shown popup produced a lead, not what share of your visitors became leads. And if you're after a mobile vs desktop web form conversion rate, a popup is the closest thing we measure: a short form shown on top of the page, where phones come out ahead.
Why popups and websites point in opposite directions
Site-level benchmarks and popup benchmarks measure different things, so they can rank the devices differently without either one being wrong. Most site-level studies of mobile vs desktop conversion rates count orders per session, and there desktop usually wins:
| Study | What it counts | Desktop | Mobile |
|---|---|---|---|
| Contentsquare 2026 Digital Experience Benchmark (99 billion sessions, 6,500 websites) | Average conversion rate | 3.4% | 2% |
| DRIP Agency (486 million sessions, 117 European e-commerce brands, March 2025 – February 2026) | Median orders ÷ sessions | 3.93% | 2.46% |
| Dynamic Yield conversion rate benchmark (trailing 12 months, read September 2026) | Conversion rate by device | 2.37% | 2.88% |
Smart Insights' e-commerce benchmark compilation lands where most studies do, with desktop converting at about 1.7 times the smartphone rate. Dynamic Yield's figures are the exception in the table, with mobile slightly ahead.
Popupsmart's popup data points the other way. Here's how I read the gap; this is my interpretation, not something the benchmark measured:
- A different action. An order needs a cart, an address and a card. A popup lead needs an email address or a phone number, which a phone's autofill can often fill in one tap. DRIP's data shows where phones lose: checkout abandonment was 62.4% on mobile against 50.5% on desktop, and a popup lead never reaches checkout.
- A different base. Site studies divide by sessions, including every instant bounce. Our rates divide by popup displays, so a visitor only counts once a popup has appeared.
- Different sites. Our campaigns come only from sites that run Popupsmart popups, which is a different mix from Contentsquare's or DRIP's samples.
- A different screen. On a phone, a popup covers most of the view. On desktop it sits in a wide window, competing with tabs and a second monitor.
So if your mobile store converts worse than desktop, don't assume your mobile popup will too. Ask for the email or phone number on the phone, where the request is small, and let the purchase happen later on whichever device the visitor prefers. Check where your store sits against the average website conversion rate, then use the next section to increase mobile conversion rates with popups.
How to increase mobile conversion rate with popups
A popup won't fix a slow page or a long checkout. What it can do on a phone is turn a visit that won't end in an order today into a lead you can follow up, and tell you why the order didn't happen. Four changes, in this order. The three numbers below come from the same 2026 benchmark but cover all devices, not mobile alone.
Ask for one thing. Popups asking for one or two fields convert 0.88% and 0.94%, against 0.56% for three fields (median campaign; spin-to-win and other gamified popups are counted separately). On a phone every extra field means another round of typing, so the email address or the phone number is enough. Collect the rest after the first order.
Give a reason to type it. Signup popups that offer a discount code convert 1.46% vs 0.75% for signup popups without one. The discount popup guide covers how to size the offer.
Put it where mobile buyers stall. Popups on cart and checkout pages convert 4.57% vs 1.07% on the home page (median campaign); blog pages convert 0.23%. The cart is where a phone visitor is closest to buying, and the cart abandonment popup examples show offers built for that moment.
Ask the visitors who don't buy. A one-question survey on the cart page ("What stopped you from checking out today?") finds mobile friction your analytics can only hint at, like a payment method you don't offer or a form that breaks on one phone model. Popupsmart's builder has single-choice, rating and opinion-scale elements for this, and the popup survey examples show how other stores word the question.
Then judge the popup by its mobile lead rate per display, next to the 1.02% median above, not by the store's order rate.
How mobile visitors behave around a popup
Mobile visitors aren't one group. Our data splits them by operating system, screen width and browser, and three results stand out:
- Android vs iPhone. On the same popup, Android visitors click more often than iPhone visitors. Because it's the same popup, the gap isn't down to Android-heavy sites running different campaigns.
- Screen width. Visitors on smaller phone screens (under 360 px wide) click popups more often than visitors on standard 390–429 px phones. The data doesn't say why; my guess is that the popup fills more of a narrow screen.
- In-app browsers. Visitors browsing inside the Instagram or Facebook app show no measurable difference in popup conversion from visitors in a normal mobile browser. Our data gives no reason to build a separate popup for in-app traffic.
Decisions are quick. 71% of visitors who close a popup do so within 5 seconds of it appearing, and 61% of popup leads are submitted within 30 seconds of the popup appearing. Both figures cover all devices. Overall, 40.5% of popup displays end with the visitor closing the popup (all displays pooled, February 2025 – September 2026, since close tracking began).
Timing and triggers by device
Our data doesn't support a device-specific number for popup timing. Three findings from the 2026 benchmark, all measured across devices:
- Popups that wait before appearing convert 0.83% vs 0.61% for popups shown the instant the page loads (median campaign). The direction holds in every year of data, but the difference is not statistically reliable, so treat it as a lean, not a rule.
- The exact delay length (0–5 seconds vs 21–60 seconds) makes no measurable difference to conversion.
- Exit intent shows no statistically reliable advantage: popups on the most sensitive exit-intent setting converted 1.10% vs 0.78% without exit intent (median campaign), a gap that could be chance.
The patterns our data does show are about frequency and audience. The first two times a visitor sees a popup in a week convert at similar rates (1.33% and 1.22% of displays, pooled); from the third view conversion falls, and from the sixth view it is 0.41%, 31% of the first-view rate. And new visitors convert on popups more often than visitors who were on the site in the previous 7 days: the same popup converts better for new visitors in 75% of campaigns (median gap 0.30 percentage points; pooled 1.28% vs 0.54% of displays).
Usability research points the same way as our lean. Nielsen Norman Group's popup guidance warns that with a popup on arrival, "the users' task is interrupted before they even land on the page." In Baymard Institute's 2014 usability testing, when an overlay appeared on page load, "the vast majority of the test subjects would reflexively close the overlay dialog, not even glancing over its contents."
Starting points I'd test on each device (advice, not benchmark results):
| Trigger | Desktop | Mobile |
|---|---|---|
| Time or scroll | After the visitor has read part of the page, for example 8–12 seconds or 35–50% scroll on long pages | After some engagement, for example 5–7 seconds of scrolling or 20–30% of the page |
| Exit intent | Cursor moving toward the tabs or close button; worth testing on cart and pricing pages | Popupsmart detects it from fast upward scrolling; switch it on for mobile separately |
| Events | A multi-step offer after a pricing or product visit | After an "Add to cart" or "View more" tap |
| Frequency | No more than two views per visitor per week | Same cap |
Setup details are in the exit-intent targeting help page and the popup timing guide.
Designing popups for each device
Design is where device differences are easiest to act on. One format result from our benchmark applies to both devices: center modal popups convert 0.88% vs 0.49% for corner/slide-in boxes (median campaign). On a phone, a center modal still has to leave the page usable. Google's guidance on intrusive interstitials is blunt: "Don't obscure the entire page with interstitials."
The thumb zone
Most mobile interactions happen with the thumb — and that has major design implications. Fitts’ Law, a UX principle dating back to the 1950s, says that the closer and larger a target is to a user’s natural reach zone, the faster and easier it is to tap. Smashing Magazine's 2019 article on bottom navigation applies it to phones: "A bottom hamburger menu icon will have a much lower interaction cost compared to the top menu icon because it's closer."
✅ Practical lessons for popup design:
- Keep CTAs within the bottom 40% of the viewport.
- Avoid stacking fields or placing “close” icons in unreachable top corners.
- Use bold, tappable CTAs — not tiny text links.
Attention and first impressions
Every popup competes for mental bandwidth. On mobile, that bandwidth is tiny.
- 📱 Mobile screens create higher cognitive load — there’s less visible context, smaller text, and limited multitasking space.
- 💻 Desktop users, in contrast, process information more linearly — scanning is easier thanks to larger layouts and visible navigation.
Nielsen Norman Group's research on first impressions found that "a decision on aesthetics is made as early as 50 milliseconds into visiting a site, and rarely changes if you give people more time." 🧠 Implication:
- Mobile popups must deliver one clear action, not a list of options.
- Desktop popups can afford slightly more context — testimonials, visuals, or short forms — without overwhelming the user.
How that plays out, choice by choice:
| Design choice | Mobile | Desktop |
|---|---|---|
| Format | Center modal, smaller than the screen | Center modal; slide-ins for low-pressure messages |
| Fields | One: email or phone | One or two; multi-step popups for demos and quotes |
| Copy | A headline and a button | A headline, one supporting line, an optional image |
| Close button | Large, visible and reachable | Standard, top right |
| Motion | A short slide-up or fade-in | A fade-in |
🧩 What works best:
- Add a slight fade-in or slide-up motion — easing visual shock.
- Use dimmed background overlays to keep focus without blocking context.
In Popupsmart's builder, style changes apply to both views, so a genuinely different mobile design means a separate campaign with the desktop view switched off. The guide to desktop and mobile views shows how.
Tone matters on both screens. A soft question ("Want early access?") reads as an offer; guilt copy ("Don't leave!") reads as pressure. We don't have benchmark data on wording, so A/B test your popups before settling on either. For worked examples, see our mobile popup design guide and the popup UX mistakes that hurt on both devices.
Bounce rate and page-level context: mobile vs desktop
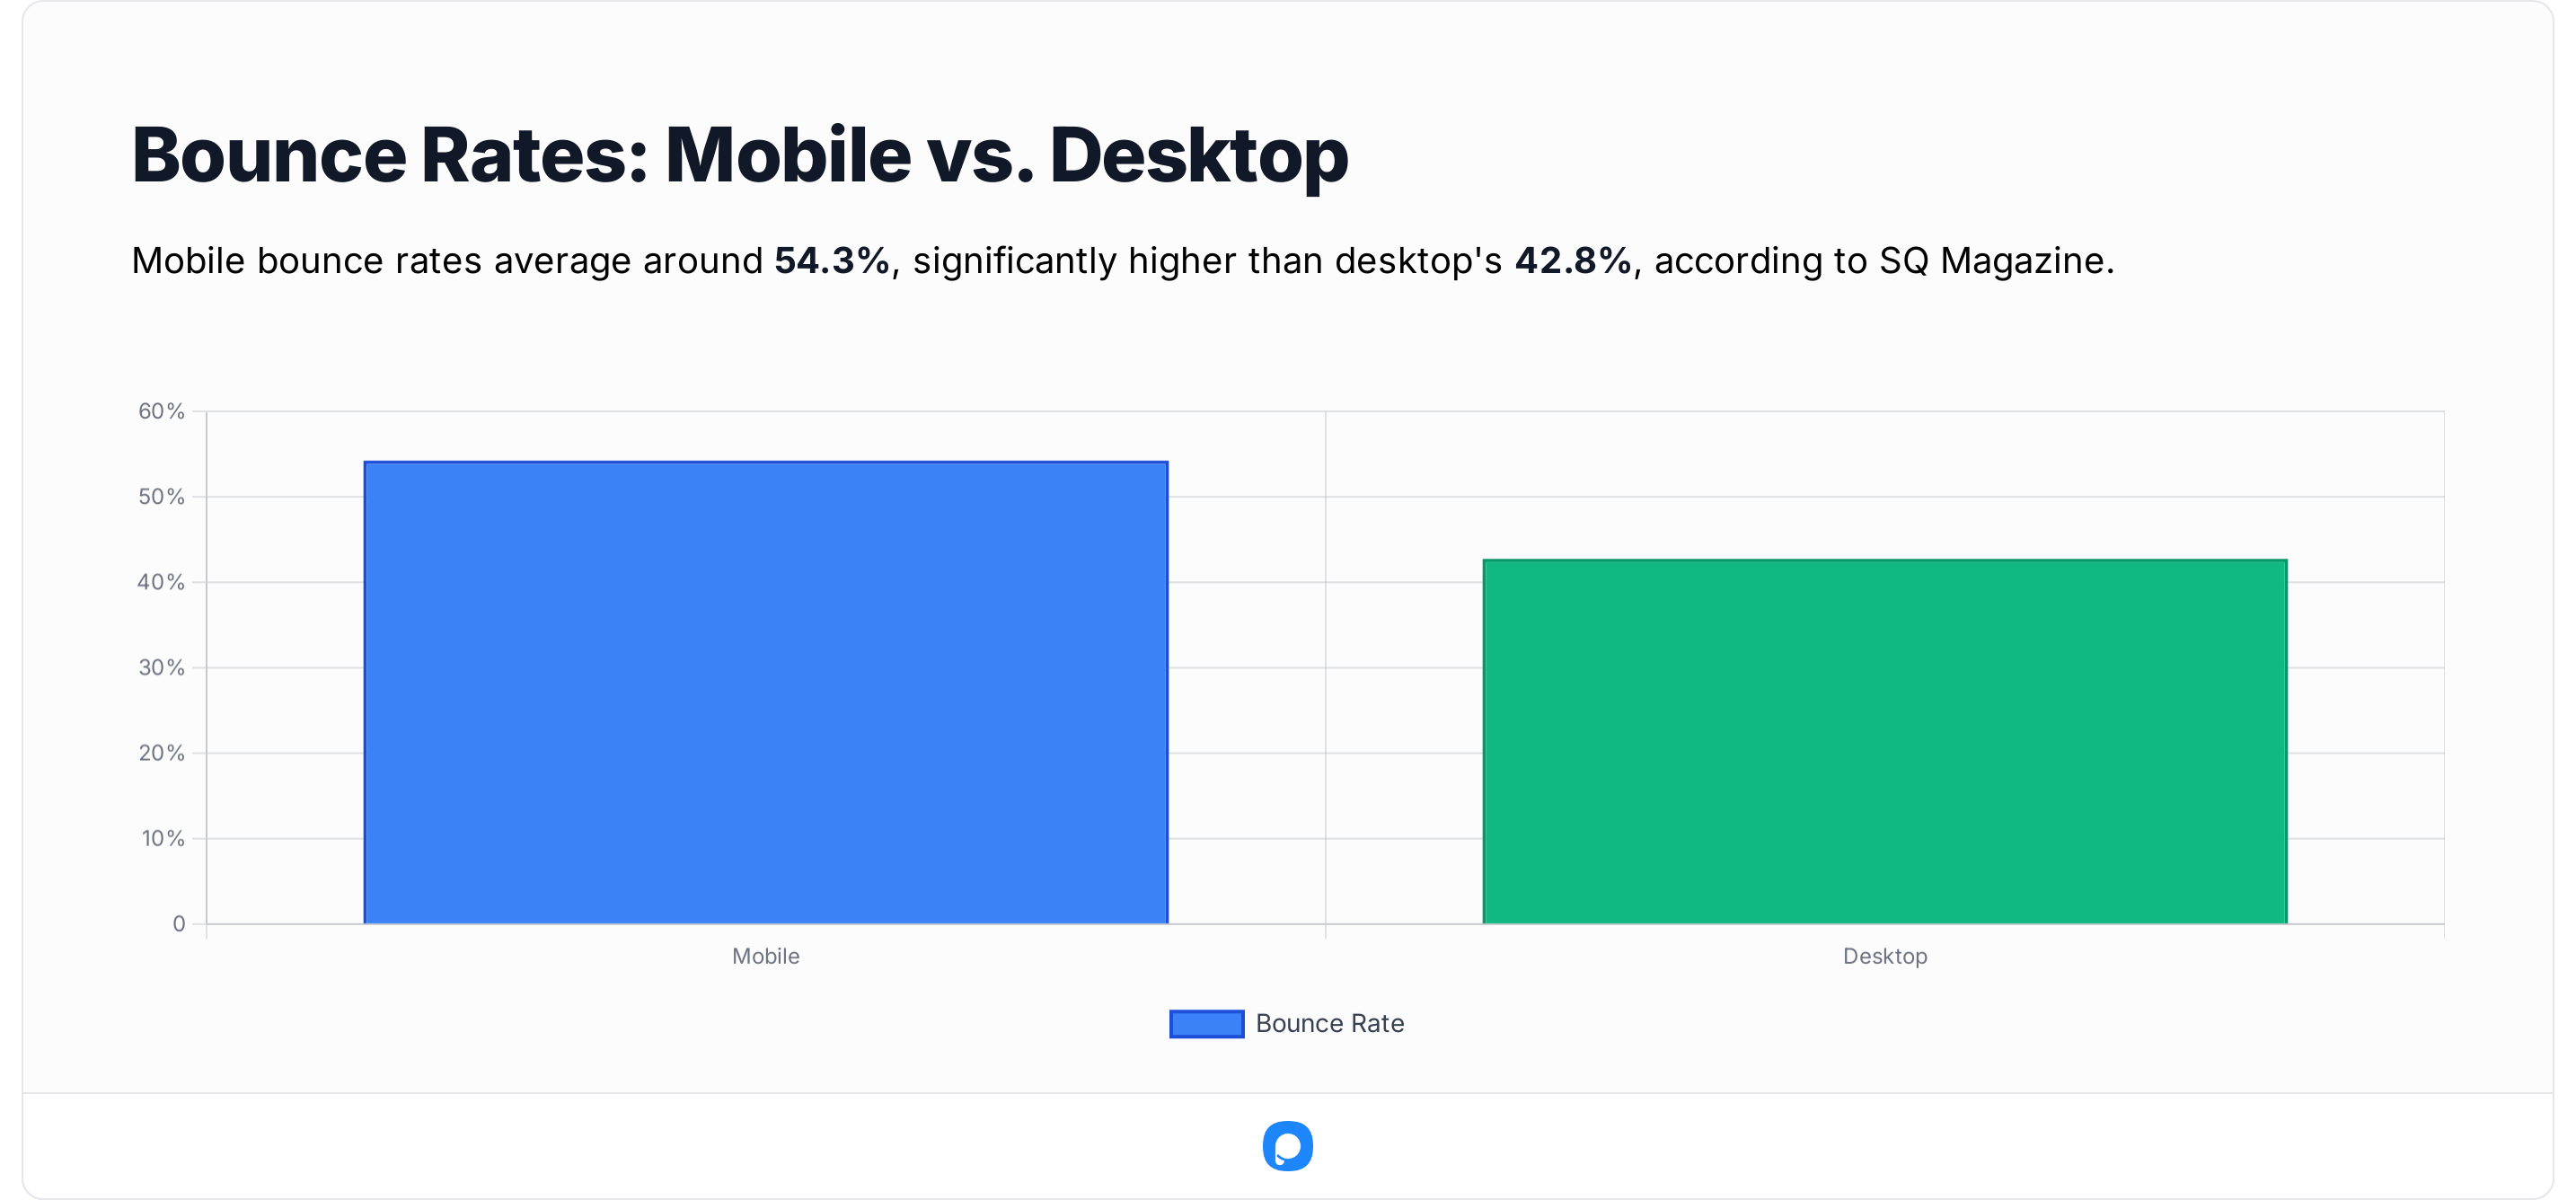
Mobile bounce rates run higher than desktop in both compilations we checked, by roughly 11 to 12 percentage points. SQ Magazine's mobile vs desktop statistics put mobile bounce rates at 54.3% on average, against 42.8% on desktop. Digital Applied's 2026 bounce rate benchmarks show cross-industry medians of 51.8% on mobile and 39.7% on desktop. Neither names a single dataset behind its device split, so read them as a direction rather than a target. Shorter sessions + higher bounce rates on mobile mean that interruptive popups or heavy forms face high risk of abandonment.
Check which bounce rate you're comparing against. In Google Analytics 4, bounce rate is "the percentage of sessions that were not engaged", and a session counts as engaged if it lasts longer than 10 seconds, has a key event, or has 2 or more page views. A mobile visitor who reads for 8 seconds and leaves is a bounce.
Speed feeds bounce before any popup fires. Google's research found that 53% of visits are likely to be abandoned if pages take longer than 3 seconds to load. A Deloitte and 55 study published on web.dev found that "a 0.1 second improvement of mobile site speed increases conversion rates by 8.4% for retail sites." A popup should never be the thing that slows a phone page down.
Traffic share
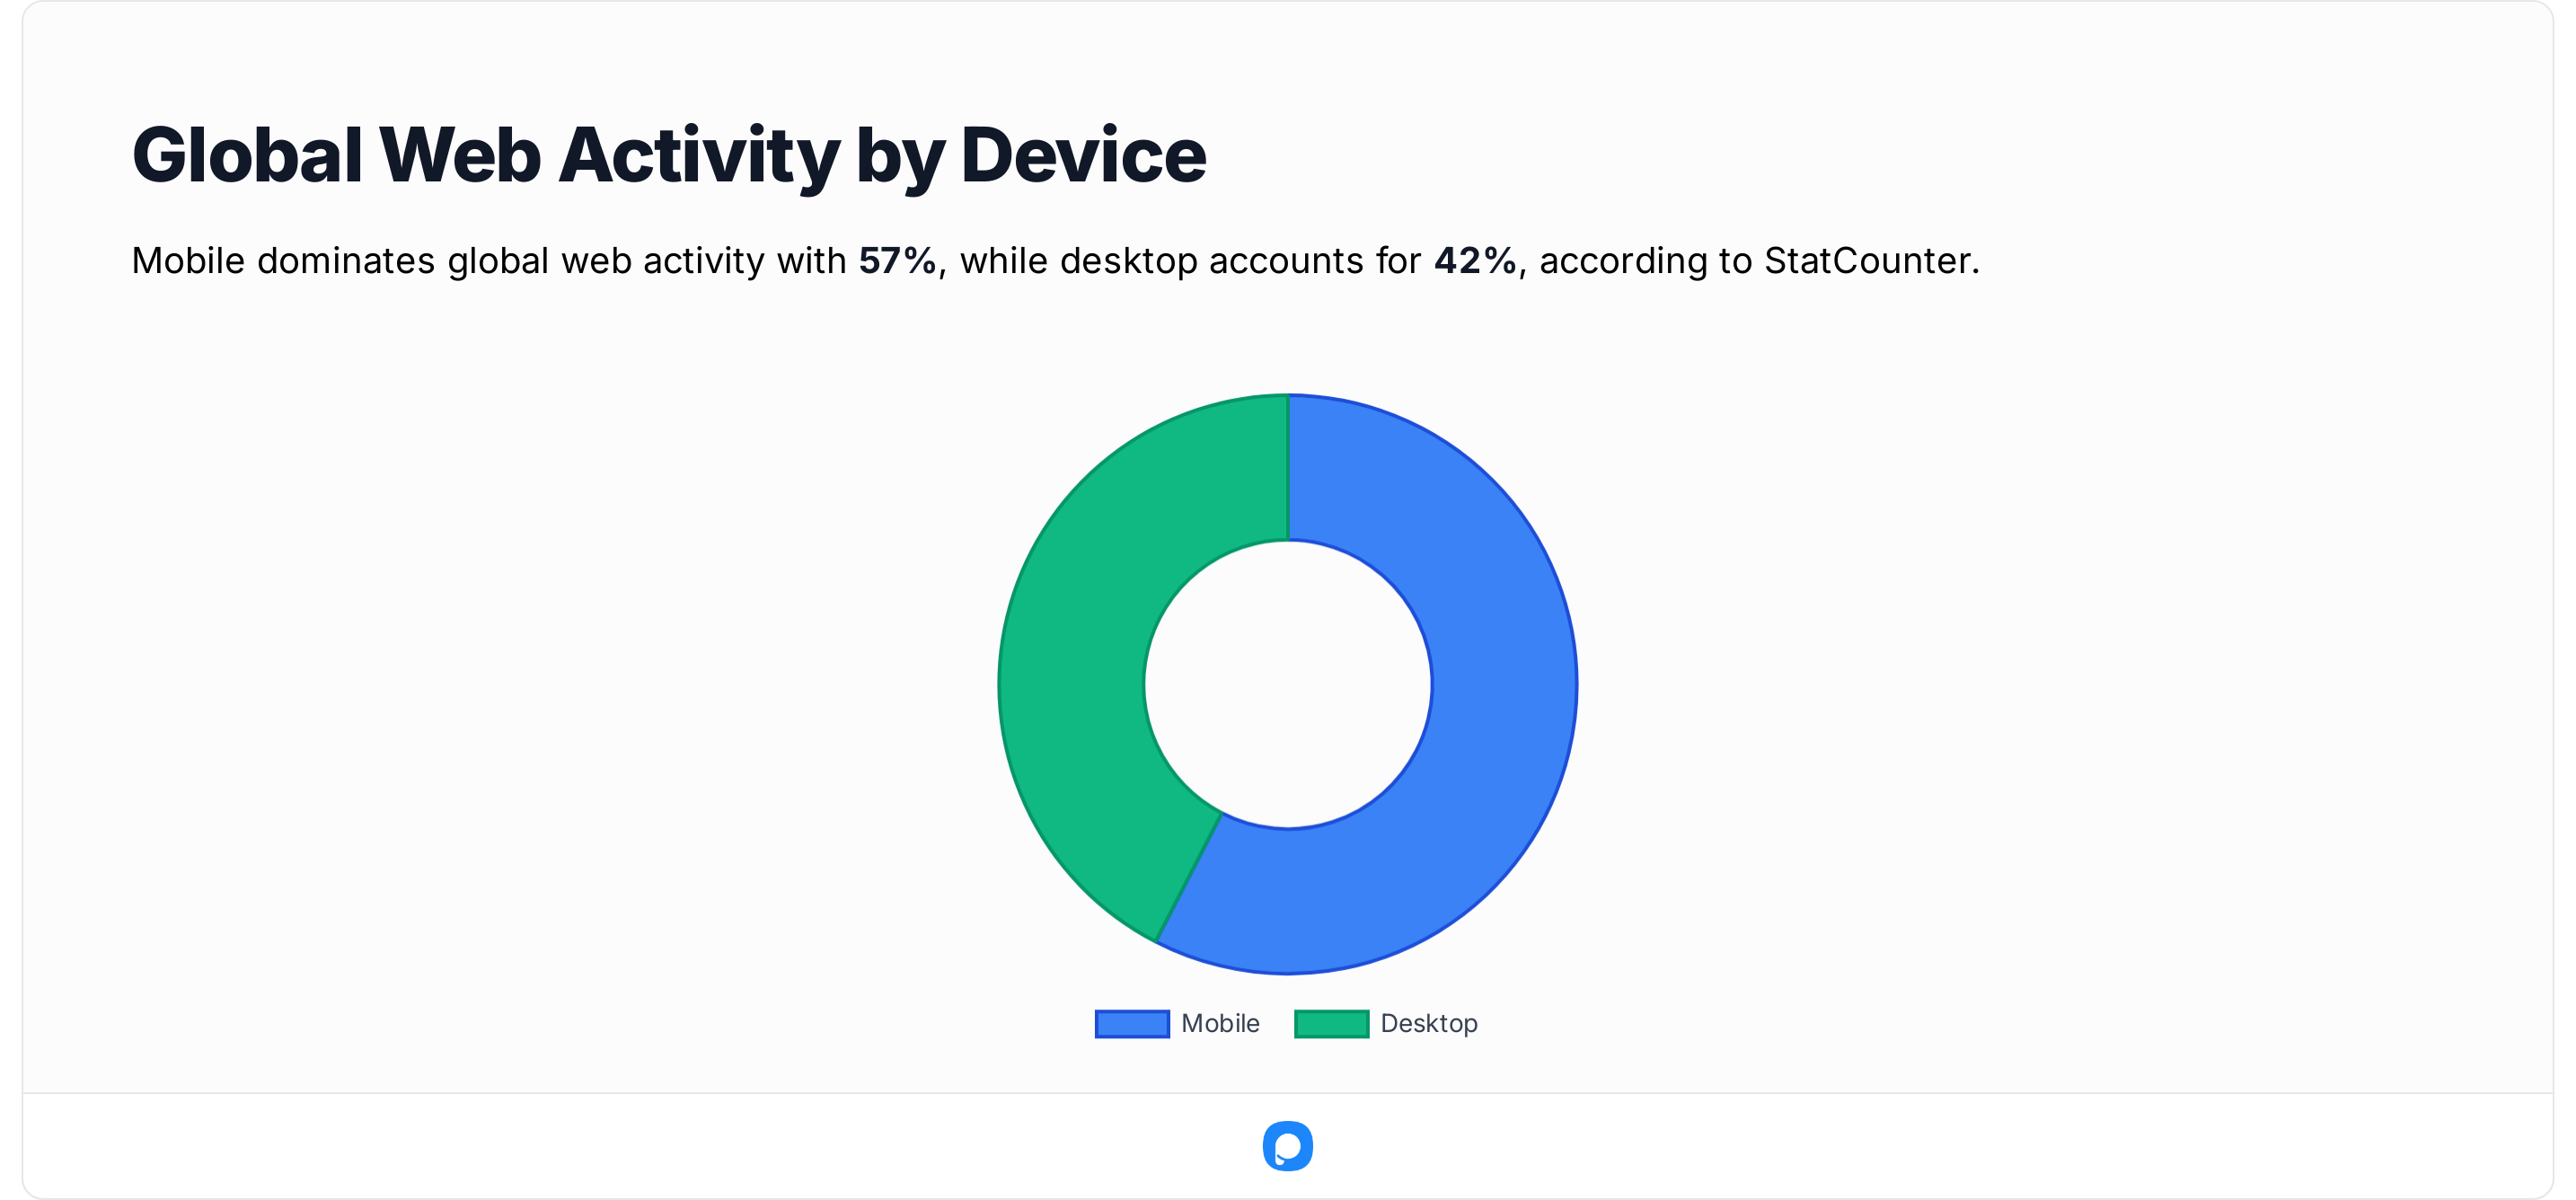
StatCounter's worldwide platform figures move a lot from month to month. In September 2025 they showed mobile at 56.52% and desktop at 42.11%; in August 2026 the two were almost level, at 49.36% and 49.11%. Similarly, a report by DesignRush states mobile devices now contribute about 62.66% of all global web traffic, compared with ~35.69% for desktop (StatCounter, May 2025).
What this means: Mobile is the dominant entry point — but desktop is still very relevant for meaningful sessions.
Session length
Desktop sessions are longer in both sources I checked. A study by Semrush reveals that in 2023 desktop sessions lasted between ~996–1,918 seconds, whereas mobile sessions were shorter (704–775 seconds range). This means desktop visitors generally spend significantly more time per visit than mobile users. Contentsquare's 2026 benchmark measured 4:46 minutes per session on desktop against 2:20 on mobile, and desktop, with under a third of visits, drove almost 47% of total time spent on site.
What I take from this for popups:
- Popups on mobile have a smaller window for impact, because users are moving fast, multi-tasking, or using devices in transit.
- Desktop popups have a larger window to build context, trust, and more complex offers, because the user is giving more time and attention.
- If a popup strategy treats both devices identically, it’s inherently leaving performance on the table, because the browsing behaviour context has changed.
- Longer desktop sessions don't turn into a higher desktop popup rate in our data. Time on site and willingness to leave an email are different things.
What to change on each device first
That’s why real optimization today isn’t about designing “responsive popups.” It’s about designing responsive experiences, popups that adapt not only in size but in strategy:
- When they appear
- What they say
- How much effort they demand
If you run one popup for every device today, here's the order I'd work in:
- Split your popup report by device before changing anything, and compare each device's lead rate per display with the medians above.
- Build a mobile version of your main popup with one field and a short headline, and keep the extra context for desktop.
- Don't fire on page load. Waiting is only a lean in our data, but the usability research agrees with it.
- Cap frequency at two views per visitor per week, and give new visitors priority.
- Test exit intent on desktop cart and pricing pages instead of assuming it wins.
To start, pick one of the popup templates, run a mobile and a desktop campaign side by side, and give each a few weeks.
How we measured
Every Popupsmart number in this post comes from the 2026 benchmark and follows the same rules:
- Scope: The dataset covers 1.98 billion page views, 499.6 million popup displays and 1.84 million leads: 28,674 campaigns from 11,533 businesses that ran a popup with Popupsmart between January 2024 and September 2026.
- Benchmark set: 10,768 campaigns with at least 1,000 displays and 14 active days, from 4,559 businesses. Device medians use campaigns with at least 500 displays on that device.
- Lead: a popup submission that contains an email address or phone number, counted once per campaign per page load.
- Lead conversion rate: leads ÷ displays, for popups that ask for an email or phone number, reported as the median campaign.
- Click rate: clicks ÷ displays, reported as the median campaign.
- Cleaning: bot traffic removed.
- Limitations: the data covers only sites that run Popupsmart; rates are per display, not per visitor; close tracking starts in February 2025; the 2026 figures aren't comparable with the 2025 edition of this post, which used different definitions.
Frequently asked questions
Do popups convert better on mobile or desktop?
On mobile, in Popupsmart's 2026 benchmark (January 2024 – September 2026). The median campaign converts 1.02% of its mobile popup displays into email or phone leads, against 0.57% of its desktop displays, and records a click on 2.99% of mobile displays vs 1.34% on desktop. Site-level studies that count purchases per session usually show desktop ahead, because they measure a different action.
Is bounce rate higher on mobile or desktop?
Mobile. SQ Magazine reports average bounce rates of 54.3% on mobile and 42.8% on desktop, and Digital Applied's 2026 cross-industry medians are 51.8% on mobile and 39.7% on desktop. Check the definition before you compare: in Google Analytics 4, a bounce is a session that isn't engaged, meaning it lasts 10 seconds or less, has no key event and has fewer than 2 page views.
Why do site-level studies show desktop converting better?
They count a different thing. Contentsquare's 2026 benchmark and DRIP's study of 486 million sessions measure purchases against sessions, and buying on a phone runs into checkout friction. A popup lead only needs an email address or a phone number, and Popupsmart's rates divide by popup displays, so the two kinds of benchmark can rank the devices differently.
When should I show a popup on desktop?
After the visitor has shown some interest, such as reading part of the page. In our 2026 benchmark, popups that wait convert 0.83% against 0.61% for popups shown on page load (median campaign), a lean that isn't statistically reliable, and the exact delay length made no measurable difference. Exit intent is worth testing on cart and pricing pages, but it showed no reliable advantage.
What's the ideal popup timing for mobile?
There isn't a proven ideal: the delay length (0–5 seconds vs 21–60 seconds) made no measurable difference to conversion in our 2026 benchmark. Start with a few seconds of scrolling or about a quarter of the way down the page, then test. Make the offer clear at first glance, because across all devices 71% of visitors who close a popup do so within 5 seconds of it appearing.
Should I use the same design for mobile and desktop?
No. Mobile popups should be compact, gesture-friendly, and visually clean. Desktop popups can use richer visuals, multi-step flows, and slightly longer copy because users have more screen space and attention span. On both, a center modal is a sensible default: in our 2026 benchmark, center modal popups converted 0.88% vs 0.49% for corner or slide-in boxes (median campaign).
Do exit-intent popups work on mobile?
They can run on mobile, but detection works differently. Phones have no cursor, so Popupsmart detects exit intent on mobile from fast upward scrolling, and you switch it on for mobile separately. Across devices, exit intent showed no statistically reliable advantage in our 2026 benchmark: the most sensitive setting converted 1.10% vs 0.78% without exit intent (median campaign), a gap that could be chance.
What changed in this post
Our separate post on increasing mobile conversion rates was merged into this one. Its popup advice now sits in one new section, built on 2026 benchmark findings about form length, discount offers and page type.
The first edition reported desktop popups ahead of mobile. Its figures came from a 2025 dataset with a different definition (leads divided by interactions, averaged across campaigns) that could not be reproduced from raw data. This edition uses Popupsmart's 2026 benchmark instead: leads that contain an email address or phone number, divided by popup displays, reported as the median campaign. On that measure mobile is ahead. The 2025 device rates, the three charts built on them, the qualified-leads comparison and the timing lifts were removed. Every external statistic was re-checked in September 2026; claims the cited pages did not state were removed, and the traffic-share figures were updated.
Initial publication.