Ecommerce Optimization Strategies to Boost Sales in 2026
Ecommerce optimization improves an online store to boost conversions, sales, and UX across the buyer journey using data-driven changes (UX, product pages, checkout, SEO/speed, A/B tests, analytics/personalization), plus tactics like UGC, live chat, better returns, search/filters, and popups supported by tools like GA, Hotjar, Optimizely, SEMrush, and Popupsmart.
Most ecommerce optimization advice still reads like it was written in 2019 — buy a faster theme, simplify the checkout, send a welcome email. That checklist is fine. It also won't move the needle in 2026, when global retail ecommerce sits at $6.88 trillion, mobile is the dominant device, and the average store still converts at under 3%. This guide goes deeper: what to fix, how to measure it, and the strategies actually shifting AOV and retention this year.
Ecommerce optimization is the ongoing process of improving how an online store turns traffic into revenue — across conversion rate, average order value, retention, mobile experience, site speed, and trust signals. In 2026, the average ecommerce conversion rate is 2.8% and 63% of traffic is mobile, so optimization wins now come from data-led tweaks across the full journey, not one-off design refreshes.
Quick overview of all 10 strategies:
1. Fix your three benchmark gaps first — Measure conversion rate, mobile share, and AOV against 2026 norms before anything else.
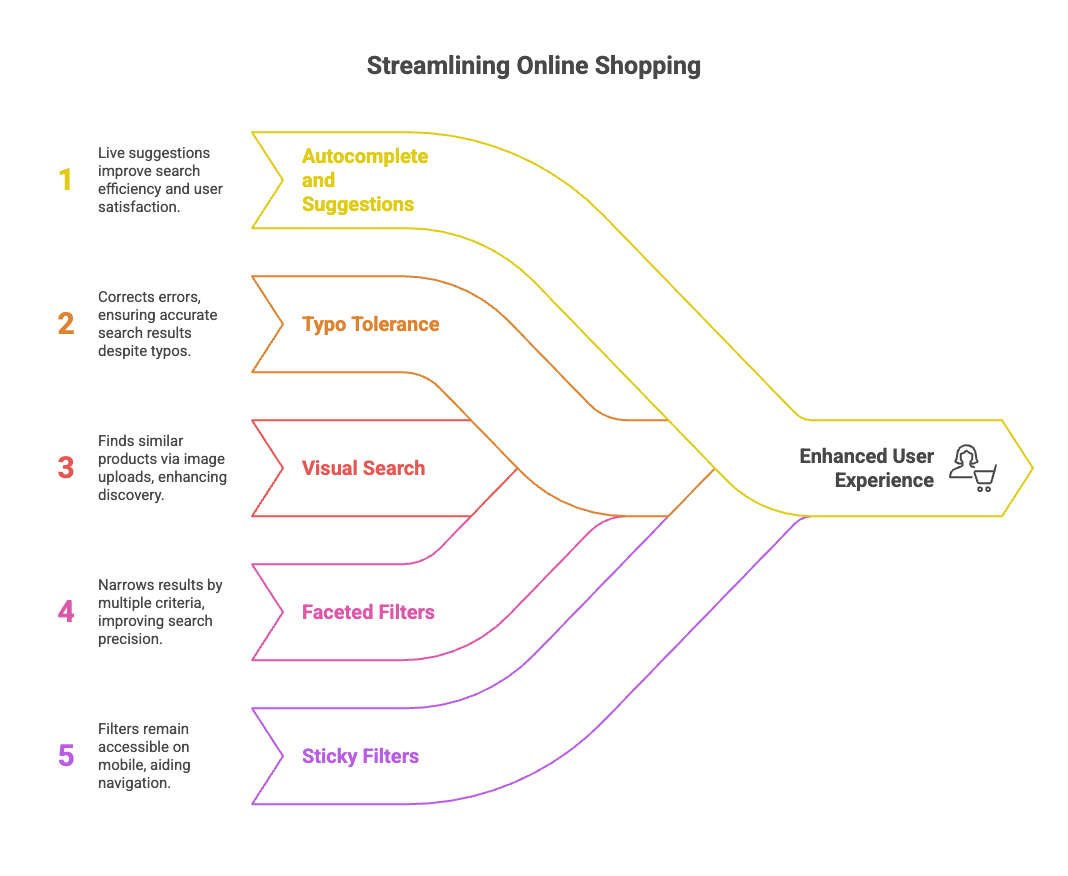
2. Rebuild the product page for scannability — The single page where money is won or lost.
3. Cut checkout from five steps to two — Friction is the most expensive bug you have.
4. Use exit-intent and behavioural popups — Catch abandoning visitors and lift email capture 5-10%.
5. Add user-generated content as social proof — Reviews, photos, and UGC lift conversion meaningfully.
6. Personalise recommendations to raise AOV — The fastest lever for revenue per visitor.
7. Make mobile the primary build, not the responsive afterthought — 63% of traffic now ships from phones.
8. Speed up the LCP by 1.5 seconds — Every second of delay above 2s drops conversion measurably.
9. Build a retention engine, not just acquisition — Repeat customers spend more, churn less, and cost less.
10. Run a continuous A/B testing programme — The compounding strategy that improves every other strategy.
What Is Ecommerce Optimization?
Ecommerce optimization is the practice of analysing and improving every step of an online store's buyer journey so more visitors complete a purchase, spend more per order, and come back. It covers technical performance, UX, copy, merchandising, personalisation, and retention — anything that affects revenue per visitor.
The shorthand most teams use: traffic gets you reach, optimization gets you revenue. According to Salsify, global ecommerce sales are expected to hit $6.88 trillion this year, accounting for 21.1% of total retail sales. That's a huge pool of buyers, but the share of visitors who actually convert is small — which is exactly why optimization compounds. A 0.5 percentage point lift on a store doing $1M in revenue is real money, and it doesn't require finding new traffic.
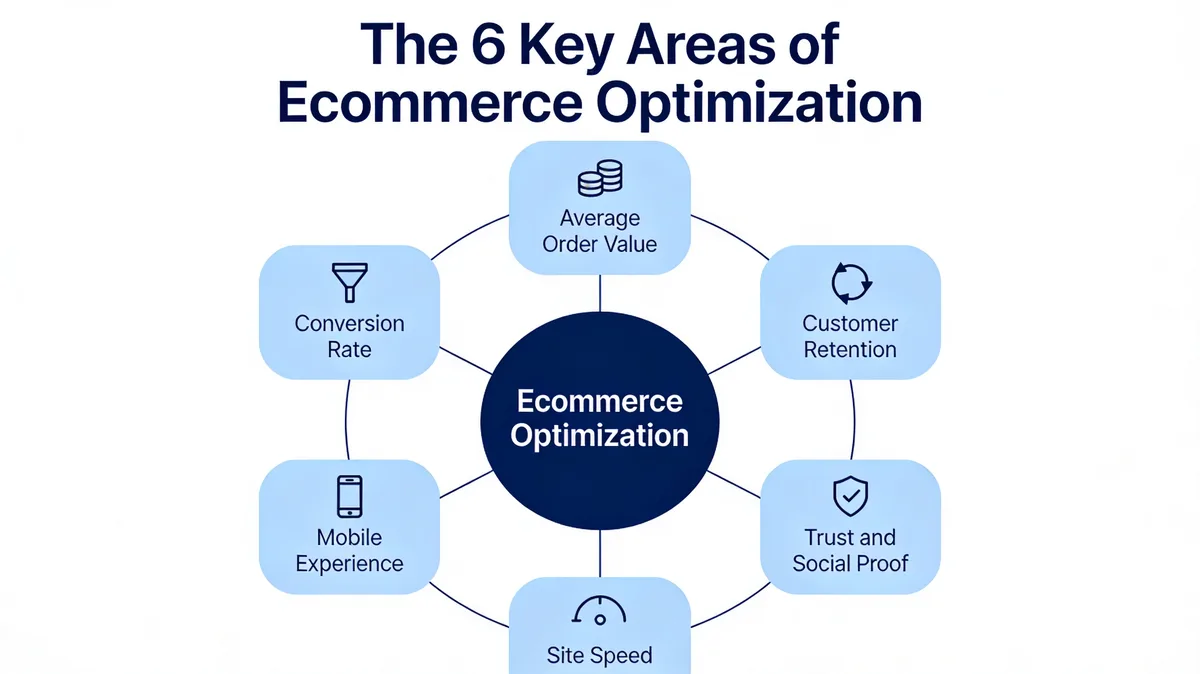
The phrase covers six concrete levers: conversion rate, average order value, customer retention, mobile experience, site speed, and trust. Strong ecommerce optimization moves several of these at once, because they reinforce each other. A faster mobile site lifts conversion, and higher conversion gives you more first-time customers to retain.
Why Ecommerce Optimization Matters More in 2026
Three shifts make optimization more valuable now than five years ago: ecommerce is bigger, mobile dominates, and customer acquisition costs keep climbing.
According to Novatize, online sales already account for just over 20% of total retail globally and that share is expected to reach roughly 21.5% in 2026. More of the pie is digital. At the same time, paid acquisition has gotten more expensive on every major channel, so margin increasingly depends on what happens after the click — not on getting more clicks.
The third shift is the gap between average and best-in-class. Stores that systematically optimize the six levers above pull ahead and stay ahead, because each lever compounds. If you've never run a structured optimization programme, you're competing against brands that have. That's the real cost of skipping this work.
How to Measure Success in 2026: The Three Benchmarks That Matter
Before you fix anything, measure against the right numbers. Most stores I see chase vanity metrics — sessions, social followers, newsletter signups — while the three numbers that predict revenue go untracked. Here are the 2026 benchmarks to set against your dashboard.
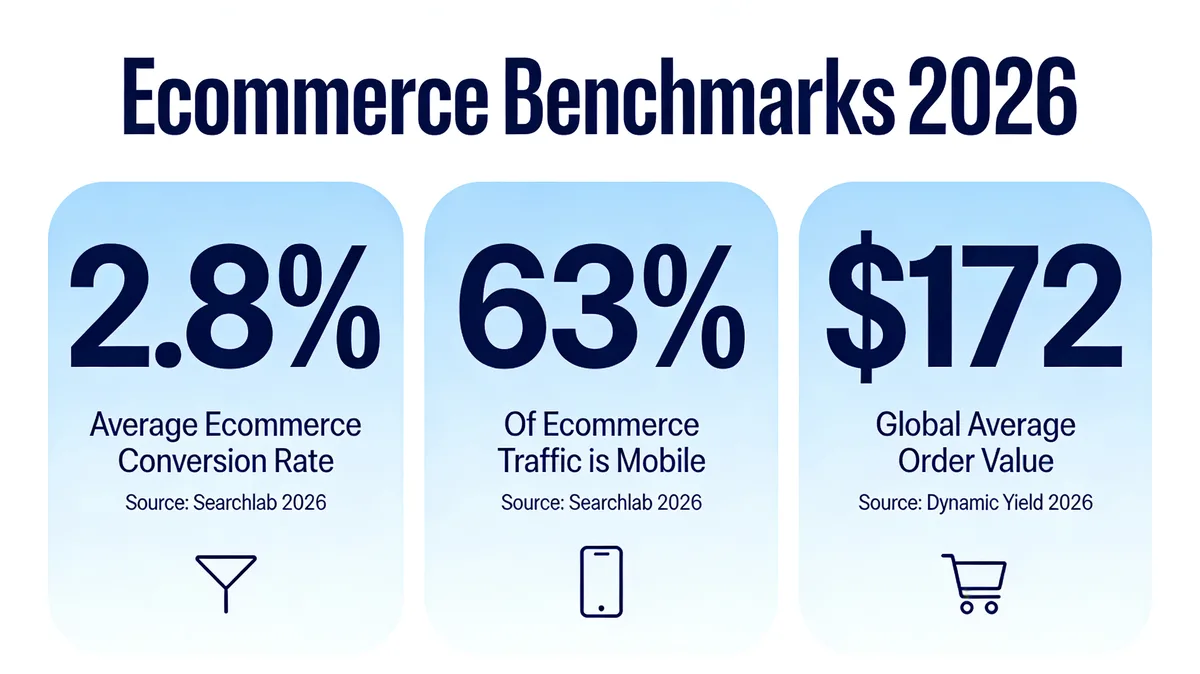
According to Searchlab's 2026 statistics, the average ecommerce conversion rate now sits at 2.8% and 63% of ecommerce traffic is mobile. The third number, average order value, lands at $172 globally per Dynamic Yield's AOV benchmark. If your store is materially under any of those three, that's where you start.
How to use these numbers:
• Conversion rate: Pull your last 90 days of sessions and orders from analytics. If you're under 2%, your problem is friction or trust. Between 2-3%, you're average — gains will come from AOV and retention. Over 3%, you're top quartile and the next gains come from segmentation.
• Mobile share: Check what percentage of your sessions are mobile, then what percentage of your revenue is mobile. If revenue share trails session share by more than 10 points, mobile UX is leaking money.
• AOV: Track this weekly, not monthly. Compare against your category — Dynamic Yield reports Consumer Goods AOV hit $418 in April, a 25% spike from March, so seasonality matters.
For a deeper teardown, our ecommerce CRO audit guide walks through the full process step by step. Set baseline numbers before you change a single thing — without them, you can't tell whether a strategy worked.
1. Fix Your Three Benchmark Gaps First (Low Effort, High Impact)
The first strategy isn't a tactic, it's an act of triage. Most stores try to optimize five things at once and end up with no clear signal on what worked. Instead, pick the single weakest of your three benchmarks and dedicate the next 30 days to it.
How to implement:
1. Map your numbers against the benchmarks above — conversion rate, mobile revenue share, AOV. Put them in a one-tab spreadsheet so the gap is visible.
2. Pick the biggest gap — not the one that's most fun, the one that's most behind. If you convert at 1.4% (vs 2.8% benchmark), conversion rate is your priority and AOV experiments are a distraction.
3. Identify two diagnostic checkpoints — for conversion, that's typically "add to cart rate" and "cart-to-checkout rate". For AOV, it's "items per order" and "average item price". Knowing which sub-metric is broken tells you where to fix.
4. Commit 30 days to that lever only — resist the urge to also "refresh the homepage" or "redesign the logo". Focus is the strategy.
5. Run a single A/B test on the diagnostic checkpoint — small, well-targeted experiments win.
According to Invesp, a focused optimization project delivered an 18% uplift in conversion rates for an ecommerce client, alongside measurable user experience improvements. The eBay engagement focused on a narrow set of journey changes rather than a site-wide redesign, which is the pattern to copy. Expect to see early lift signal within 21-30 days if your store gets at least 10K sessions a month; lower-traffic stores need closer to 60 days for clean A/B significance.
2. Rebuild the Product Page for Scannability (Medium Effort, High Impact)
The product page is where most ecommerce revenue is won or lost. A curious visitor becomes a buyer — or doesn't — within the first six seconds on this page. Most product pages I audit are designed for the brand, not the shopper: hero image, marketing copy, then specs buried below the fold. Reverse that. Lead with the four things shoppers actually scan for in the first six seconds — price, fit, reviews, returns.
How to implement:
1. Rewrite the above-the-fold area — product name, three-bullet benefit summary, price, primary CTA, and shipping/returns reassurance all visible without scrolling.
2. Move reviews higher — the star-rating row should sit immediately under the product title, not at the bottom of the page. Include the count ("4.7 from 312 reviews") because the number is the trust signal.
3. Add at least one user-submitted photo near the gallery — staged product shots can feel polished but generic; customer photos feel real.
4. Break the description into scannable chunks — short paragraphs, bolded keywords, a "what's in the box" line, sizing or compatibility table.
5. Add a sticky add-to-cart button on mobile — visitors scroll the full page and lose the CTA otherwise.
For tactic-level depth, our product page optimization guide covers the full 11-point teardown. Expect 5-15% lift in add-to-cart rate within 30 days of a focused product page rebuild — the spread depends on how far your current page is from the pattern above. Stores starting from generic Shopify themes typically see the larger gains.
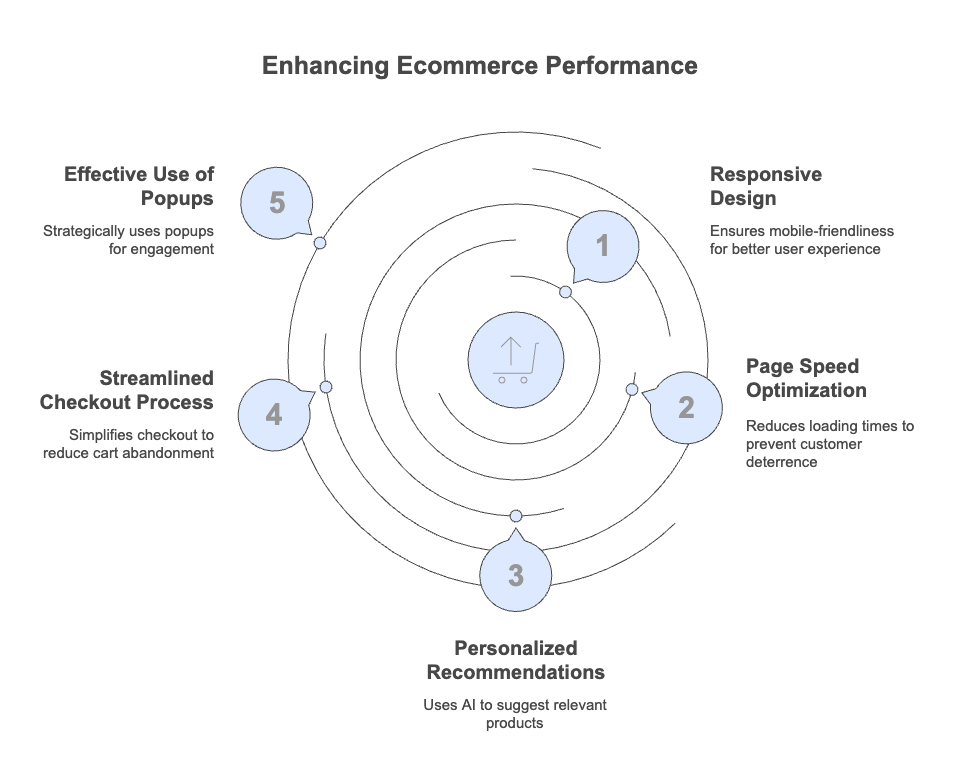
3. Cut Checkout From Five Steps to Two (Low Effort, High Impact)
Checkout is where most stores quietly lose 60-70% of the people who added something to a cart. Every additional field, every account-required wall, every shipping-cost surprise increases drop-off. Cutting checkout to two steps — contact and payment — is one of the highest-ROI changes you can make.
How to implement:
1. Enable guest checkout as the default — account creation should be opt-in at the end, never required. Forcing accounts at the start is the single biggest abandonment cause I see.
2. Combine contact, shipping, and billing into one page — accordion-style if needed. The traditional four-step wizard is dated.
3. Show shipping cost before the final step — surprise costs trigger abandonment. If you can't show exact cost, show a range.
4. Add Apple Pay, Google Pay, and Shop Pay at the top — these collapse checkout into one tap on mobile and lift mobile conversion noticeably.
5. Pre-fill addresses with autocomplete — every saved keystroke reduces abandonment.
Our Shopify checkout optimization checklist goes through 20+ checks specifically for Shopify stores. The pattern matters across platforms too — WooCommerce, BigCommerce, and custom builds all benefit from the same simplification. Expect 8-15% lift in checkout completion within two weeks if you're starting from a multi-step flow with forced account creation.
4. Use Exit-Intent and Behavioural Popups (Low Effort, High Impact)
Most popups fail because they fire at the wrong time. A welcome popup that triggers two seconds after page load interrupts every visitor before they've engaged. Behavioural triggers — exit-intent on desktop, scroll depth and inactivity on mobile — catch the people who are already leaving, not the people who are reading.
How to implement:
1. Set the primary popup to exit-intent on desktop and 50% scroll depth on mobile — mobile doesn't have a cursor, so the equivalent trigger is scroll or inactivity.
2. Make the offer specific — "10% off your first order" outperforms "join our newsletter" by 3:1 in our internal data. The discount should match your margin tolerance, not someone else's playbook.
3. Frequency cap at one impression per visitor per seven days — repeated popups erode brand trust fast.
4. Suppress on cart and checkout pages — never interrupt a buyer who's already converting.
5. A/B test the headline, not the design — "Don't go without 15% off" vs "Wait! Here's 15% off" can swing capture rate 30% on the same audience.
According to Convertica's case study, an ecommerce health brand called JustThrive saw a 100%+ increase in revenue in three months after a focused conversion optimization project — popups and on-site capture were a meaningful share of that lift. For an average store, expect exit-intent popups to convert at 3-6% of triggered visitors, with the bulk of value coming from email capture that fuels retention later.
5. Add User-Generated Content as Social Proof (Low Effort, Medium Impact)
User-generated content is anything your customers create about your product — reviews, photos, videos, social posts. It works because new visitors trust other shoppers more than they trust your marketing copy. UGC also helps SEO by adding fresh, keyword-relevant text to product pages without you writing it.
How to implement:
1. Set up a post-purchase email at day 14 — long enough for the customer to use the product, short enough that the experience is fresh. Ask for a review and a photo in the same email.
2. Offer a small incentive for photo reviews — a 10% discount on next order, loyalty points, or entry to a monthly draw. Photos lift on-page conversion more than text reviews.
3. Launch a branded hashtag on Instagram and TikTok — something specific to your brand, not generic. "#MyStyleByYourBrand" works better than "#fashion".
4. Embed a UGC gallery on product pages and the homepage — tools like Loox, Yotpo, or Stamped handle the moderation and display.
5. Re-share customer content on your own social channels — gives shoppers a reason to tag you and creates a small reward loop.
Expect 8-12% lift in conversion on product pages with active UGC galleries vs identical pages without, based on internal benchmarks I've seen across the Popupsmart customer base. The gain compounds over time as more content accumulates — six months in, your highest-trafficked pages will have dozens of customer photos doing the selling for you.
6. Personalise Recommendations to Raise AOV (Medium Effort, High Impact)
Product recommendations are the single fastest lever for AOV. They work because they reduce search friction — the shopper doesn't have to think about what else they might want, they're shown options that fit their current cart or browsing pattern. Stores that don't run recommendations are leaving the easiest revenue on the table.
How to implement:
1. Add a "frequently bought together" block on product pages — based on actual purchase pairings from your order history, not random suggestions.
2. Add a cross-sell block in the cart — "complete the look" or "customers also added" works for fashion, home, and beauty. For B2B SaaS or higher-consideration goods, use "popular with similar buyers".
3. Run a free-shipping threshold above your current AOV — if your AOV is $172, set the threshold at $200. The gap should be just enough that adding one more item makes sense.
4. Use a recommendation popup at the cart stage — our recommendation popup recipe walks through the exact setup.
5. Personalise the homepage based on browsing history — returning visitors should see categories they've engaged with, not a generic hero.
According to Dynamic Yield, the global average order value sits at $172 — but specific categories sit far higher. Consumer Goods AOV reached $418 in April, a 25% spike, showing how seasonality and category mix interact with personalisation. For more category-specific ideas, our ecommerce personalization examples guide covers 17 patterns in detail. Expect 10-20% AOV lift within 60 days of a focused recommendations programme.
7. Make Mobile the Primary Build (Medium Effort, High Impact)
Most stores still design desktop-first and then "make it work on mobile". That order is backwards now. With 63% of ecommerce traffic on mobile, the phone should be the default canvas and desktop the secondary view. Mobile-first isn't a slogan — it's a design discipline that affects every screen, font size, button, and form field.
How to implement:
1. Audit every key page on a mid-range Android phone, not just an iPhone — older Androids running on slower connections are how a real chunk of your audience experiences the site.
2. Increase tap-target size to at least 48x48px — anything smaller causes mis-taps and rage-clicks, especially on the add-to-cart button.
3. Replace hover states with explicit buttons — hover doesn't exist on touch. Mega-menus that depend on hover collapse navigation on mobile.
4. Cut image weight by 40-60% — switch to WebP or AVIF, generate responsive sizes, and remove decorative imagery that doesn't earn its bandwidth.
5. Test the mobile checkout on a real 4G connection — not desktop dev tools throttling, which is too clean. Use the actual device on actual data.
If a store moves from a 1.2% mobile conversion rate to the desktop's 3.4%, the impact on total revenue is larger than any single homepage redesign — that's the size of the prize. Stores with mobile-first builds tend to outperform on every other metric too, because the design discipline forces clearer hierarchy. Our Shopify conversion rate tactics covers 15 mobile-specific moves.
8. Speed Up the LCP by 1.5 Seconds (Medium Effort, High Impact)
Site speed is the silent killer of ecommerce conversion. Largest Contentful Paint (LCP) — the time it takes for the main visible content to load — is the metric Google uses and the one shoppers feel. Anything over 2.5 seconds is officially slow; over 4 seconds and bounce rate climbs steeply. Most ecommerce stores I audit clock LCP between 3 and 6 seconds on mobile.
How to implement:
1. Run PageSpeed Insights on your homepage and your three top product pages — note the LCP, CLS, and INP scores for mobile specifically.
2. Fix the LCP image first — it's almost always the hero or first product image. Use responsive sizes, modern format (WebP or AVIF), and add fetchpriority="high" via your theme.
3. Remove or defer unused third-party scripts — chat widgets, analytics, A/B testing tools, recommendation engines. Each one adds latency. Audit them ruthlessly — if a script loads on every page but only fires on the cart, defer it.
4. Lazy-load below-the-fold images — but never the hero. Lazy-loading the LCP image makes the score worse, not better.
5. Cache aggressively at the edge — most modern hosts (Shopify, Vercel, Cloudflare-fronted) handle this, but verify your TTLs are sensible.
A 1.5-second LCP improvement typically lifts mobile conversion by 5-12% on its own. Don't expect linear gains from going faster once you're already under 2 seconds — diminishing returns kick in. The biggest wins are for stores currently over 4 seconds, which is more common than you'd think.
9. Build a Retention Engine, Not Just Acquisition (High Effort, High Impact)
Repeat customers spend more per order, convert at higher rates, and cost essentially nothing to acquire compared to net-new. Yet most stores spend 80% of their marketing budget on acquisition and almost nothing on retention. Flipping that ratio is one of the biggest unlocks in ecommerce — and it's a longer build, because retention systems take 90-180 days to compound.
How to implement:
1. Set up a post-purchase email sequence — day 1 (order confirmation with brand story), day 7 (how to get the most from the product), day 14 (review request), day 30 (cross-sell or replenishment).
2. Launch a basic loyalty programme — points per dollar spent, redeemable for discounts or perks. Smile.io and LoyaltyLion both have entry-level tiers that pay back fast.
3. Add a replenishment reminder for consumables — if you sell anything with a predictable repurchase cycle (skincare, supplements, food, pet products), email at 80% of average reorder time.
4. Segment your email list by behaviour — first-time buyers, repeat buyers, lapsed buyers, VIPs. Each segment needs different messaging.
5. Run a win-back campaign every 90 days — lapsed customers (180+ days since last order) get a one-time recovery offer.
Retention is where the long-term margin lives. A store with strong retention can afford higher acquisition costs because each customer's lifetime value covers it — and that's the wedge against well-funded competitors. For broader CRO context, the CRO experts to follow roundup has a mix of acquisition and retention specialists worth reading.
10. Run a Continuous A/B Testing Programme (High Effort, Compounding Impact)
The compounding strategy. Every other strategy in this list improves once you test variations of it. Without a testing programme, you're making changes based on opinion. With one, you're making changes based on data — and small, consistent wins stack up. A store running one valid experiment a week, with even a 20% win rate at 5% lift, ends the year roughly 11% better than it started without any single dramatic change.
How to implement:
1. Pick one testing tool and stick with it — Shopify's built-in A/B testing for Shopify Plus stores, or a dedicated platform like Convert or VWO. Don't bounce between tools.
2. Hypothesise before designing — every test starts as "If we change X, then Y will improve because Z". No hypothesis, no test.
3. Test one variable at a time — headline, button colour, image, layout. Testing five changes at once tells you nothing about which one worked.
4. Run for at least 14 days and to statistical significance — cutting a test short to chase a "trend" is how teams convince themselves bad changes worked.
5. Document every test and outcome — winners, losers, no-impact. The losing tests are often more instructive than the winners.
Don't expect any single test to be a game-shifter. Expect 30-40% of tests to show no significant lift, 30-40% to show a small win you keep, and a handful to surprise you. The compounding only works if you keep going past the first three tests. Pair this with our ecommerce conversion rate benchmarks to set realistic targets.
Common Mistakes to Avoid
The fastest way to make optimization fail is to skip the boring parts. These are the patterns I see most often.
• Optimizing without baseline metrics: If you can't say what your conversion rate was last month, you can't tell whether anything you change works. Set up analytics before you change anything.
• Testing too many variables at once: Redesigning the homepage and changing the checkout and adding a popup in the same week means you'll never know which one moved the number.
• Chasing best practices without context: "Add a chatbot" is not a strategy. Add a chatbot if your data shows pre-purchase questions are a friction point. Otherwise it's noise.
• Stopping tests early: The biggest enemy of A/B testing is impatience. A "trend" at day 4 isn't a result — it's randomness. Wait for significance.
• Ignoring mobile when the analytics scream it: If your mobile traffic is 60% and mobile conversion is half of desktop, that's the single biggest revenue gap you have. Don't shy away because mobile design is harder.
• Treating popups as a one-time setup: The popup you launched 18 months ago is probably underperforming now. Review and refresh every quarter.
• Confusing traffic growth with revenue growth: More sessions don't help if your conversion rate is dropping. Measure revenue per visitor, not just visitor count.
Future Trends in Ecommerce Optimization
Three trends are reshaping what optimization looks like over the next 12-24 months, and worth planning for now.
AI-driven personalisation moves from "people who bought this also bought" into real-time, context-aware merchandising. The shopper who lands at 9am on a phone in commute mode gets a different homepage from the same shopper opening on a desktop at 8pm. Stores already running deep personalisation see 15-30% lift in revenue per visitor, and the gap with non-personalised stores widens each quarter.
Conversational and zero-click shopping is the second shift. Buyers increasingly start product research inside ChatGPT, Perplexity, and Google's AI Overviews — not on your homepage. That changes optimization priorities: structured data, citation-worthy stats, clear definitions, and Q&A formatting matter more than they did three years ago. The best ecommerce content now optimizes for AI extraction as much as for Google's classic ten blue links. For broader tactical depth, landing page optimization tools covers the platforms making this transition.
Headless and composable commerce is the third trend, and it's a slower burn. As more stores break free of monolithic platforms (Shopify, Magento, BigCommerce in their default forms), they can ship faster, test more, and personalise deeper. The downside: complexity. Headless isn't right for stores under $5M in revenue. For most operators, the incremental wins from optimization inside an existing platform still outweigh the cost of replatforming.
Your First 30 Days of Ecommerce Optimization
Pick three strategies, not ten. If you do nothing else after reading this:
Week 1: Set baseline metrics for conversion rate, mobile revenue share, and AOV. Find your biggest gap against the 2026 benchmarks.
Week 2: Audit and simplify the checkout. Enable guest checkout, combine shipping/billing steps, surface shipping cost early.
Week 3: Launch one exit-intent popup with a specific, brand-appropriate offer. Cap impressions, suppress on checkout, A/B test the headline.
Week 4: Review the data. What moved? Pick the next strategy from the prioritisation matrix above.
Ecommerce optimization isn't a one-time project. It's a habit — measure, test, adjust, repeat — and the stores that build it as a habit are the ones that compound past the benchmarks instead of stalling at them. If popups are part of that habit for you, start a Popupsmart account and ship your first exit-intent campaign this week.
Frequently Asked Questions
What is the 80/20 rule in ecommerce?
The 80/20 rule (Pareto principle) in ecommerce typically means that 80% of revenue comes from 20% of customers, products, or marketing channels. Identifying that 20% — top SKUs, repeat buyers, highest-ROAS channels — and doubling down on them tends to outperform spreading effort evenly. Run a 90-day revenue report broken down by product, customer, and channel to find your own 20%.
What are the 7 pillars of ecommerce?
The most common version of the 7 pillars covers Product, Pricing, Placement (channels), Promotion, People (audience), Performance (analytics), and Process (operations). Each pillar can be optimized independently, but the biggest gains come when changes in one reinforce another — for example, improving product page copy (Product) while running a popup offer (Promotion) targeted at first-time visitors (People).
How to optimize an ecommerce store for conversions in 2026?
Start by measuring against the three 2026 benchmarks: 2.8% conversion rate, 63% mobile share, $172 AOV. Whichever benchmark you're furthest behind, work on that lever first. The fastest wins are usually checkout simplification, exit-intent popups, and product page rebuilds. Slower compounding wins come from retention systems and a continuous A/B testing programme.
What's the best ecommerce optimization tactic for higher retention?
A post-purchase email sequence paired with a basic loyalty programme. The email sequence keeps your brand top of mind in the critical 30-day post-purchase window, and the loyalty programme creates a reason to come back. Both are low-cost to set up and compound over months — retention systems usually take 90-180 days to show their full impact, so start early.
You may also enjoy these guides:
• Free Shipping Popup for Shopify Carts
• 11 Product Bundling Examples for AOV

How would you rate your experience with this article? 😊