Good Average Website Conversion Rate in 2026: Benchmarks
Website conversion rates average 2–5% (overall ~2.9%), with 5%+ strong and 10%+ exceptional; finance is highest (median ~11.19%). It defines conversions (micro vs macro), key drivers, benchmarks by industry/device/source, how to calculate, and CRO tips.
Curious about what is considered a good conversion rate for a website and how yours compares? A good average website conversion rate falls between 2% and 5%, with top performers reaching 10% or higher. The benchmarks below break down rates by industry, device, and business model so you can see where your site stands in 2026.

A good average website conversion rate falls between 2% and 5%, with top performers reaching 10% or higher. According to Ruler Analytics, the overall average across fourteen industries is 2.9%, while finance sites average 11.19%. The benchmarks below break down rates by industry, device, and business model so you can see where your site stands.
What is Website Conversion?
A website conversion happens when a visitor completes a specific action you've defined as valuable. That action could be a purchase, a form submission, a newsletter signup, or a demo booking. Every business defines "conversion" differently based on its goals, and that definition directly shapes what your conversion rate means.
I've worked with SaaS companies where a conversion was a free trial signup and ecommerce brands where it was a completed checkout. The number itself doesn't tell you much until you know what's being measured. A 2% purchase rate and a 15% email signup rate can coexist on the same site, and both might be healthy.
Understanding your conversion rate benchmarks starts with clarity on what you're actually tracking. Without that, any comparison to industry averages is meaningless.
Micro vs Macro Conversions
Not all conversions carry the same weight. Micro and macro conversions represent two stages of user commitment, and tracking both gives you a clearer picture of how your funnel performs.
Micro Conversions
Micro conversions are smaller actions that signal interest but don't directly generate revenue. They're steps on the path toward your main goal. Examples include:
According to Smart Insights, sessions with product page views (a common micro conversion) approach 50% in many ecommerce stores. That's a strong engagement signal, even when final purchase rates are much lower.
Macro Conversions
Macro conversions are the end goals: completed purchases, paid subscriptions, signed contracts, booked demos. These directly affect your bottom line.
The gap between micro and macro conversion rates often reveals friction points. If 30% of visitors add items to their cart but only 2% complete checkout, you've got a clear optimization target. Tracking both conversion types helps you pinpoint where users drop off and where to focus your conversion rate optimization efforts.
What is a Good Website Conversion Rate in 2026?
A good website conversion rate in 2026 is anything above 3.5% for most industries. Rates between 2% and 5% are considered average, and anything above 5% puts you in strong territory. But "good" depends heavily on your industry, traffic source, and what you're counting as a conversion.
What Makes a Good Conversion Rate
Here's how conversion rates break down by performance tier across major industries:
| Industry | Bottom Tier | Middle Tier | Top Tier |
|---|---|---|---|
| Ecommerce | 1.84% | 3.71% | 6.25% |
| B2B | 2.23% | 4.31% | 11.70% |
| Legal | 1.07% | 4.12% | 6.46% |
| Finance | 5.01% | 11.19% | 24.48% |
| Professional Services | 2.1% | 4.6% | 9.8% |
Finance stands out with a median rate of 11.19%, nearly triple the B2B median. That's partly because finance sites often have high-intent visitors who are actively looking for a specific product (a credit card, a loan, an insurance quote).
According to First Page Sage, the average B2C conversion rate is 3.9%, slightly higher than the B2B average of 3.6%. The gap isn't as wide as many marketers assume.
If you're wondering "is 5% a good website conversion rate?" the answer is yes, for most industries. You'd be outperforming the majority of your competitors. If you're at 2%, you're not failing. You're average. And average is a starting point, not a destination.
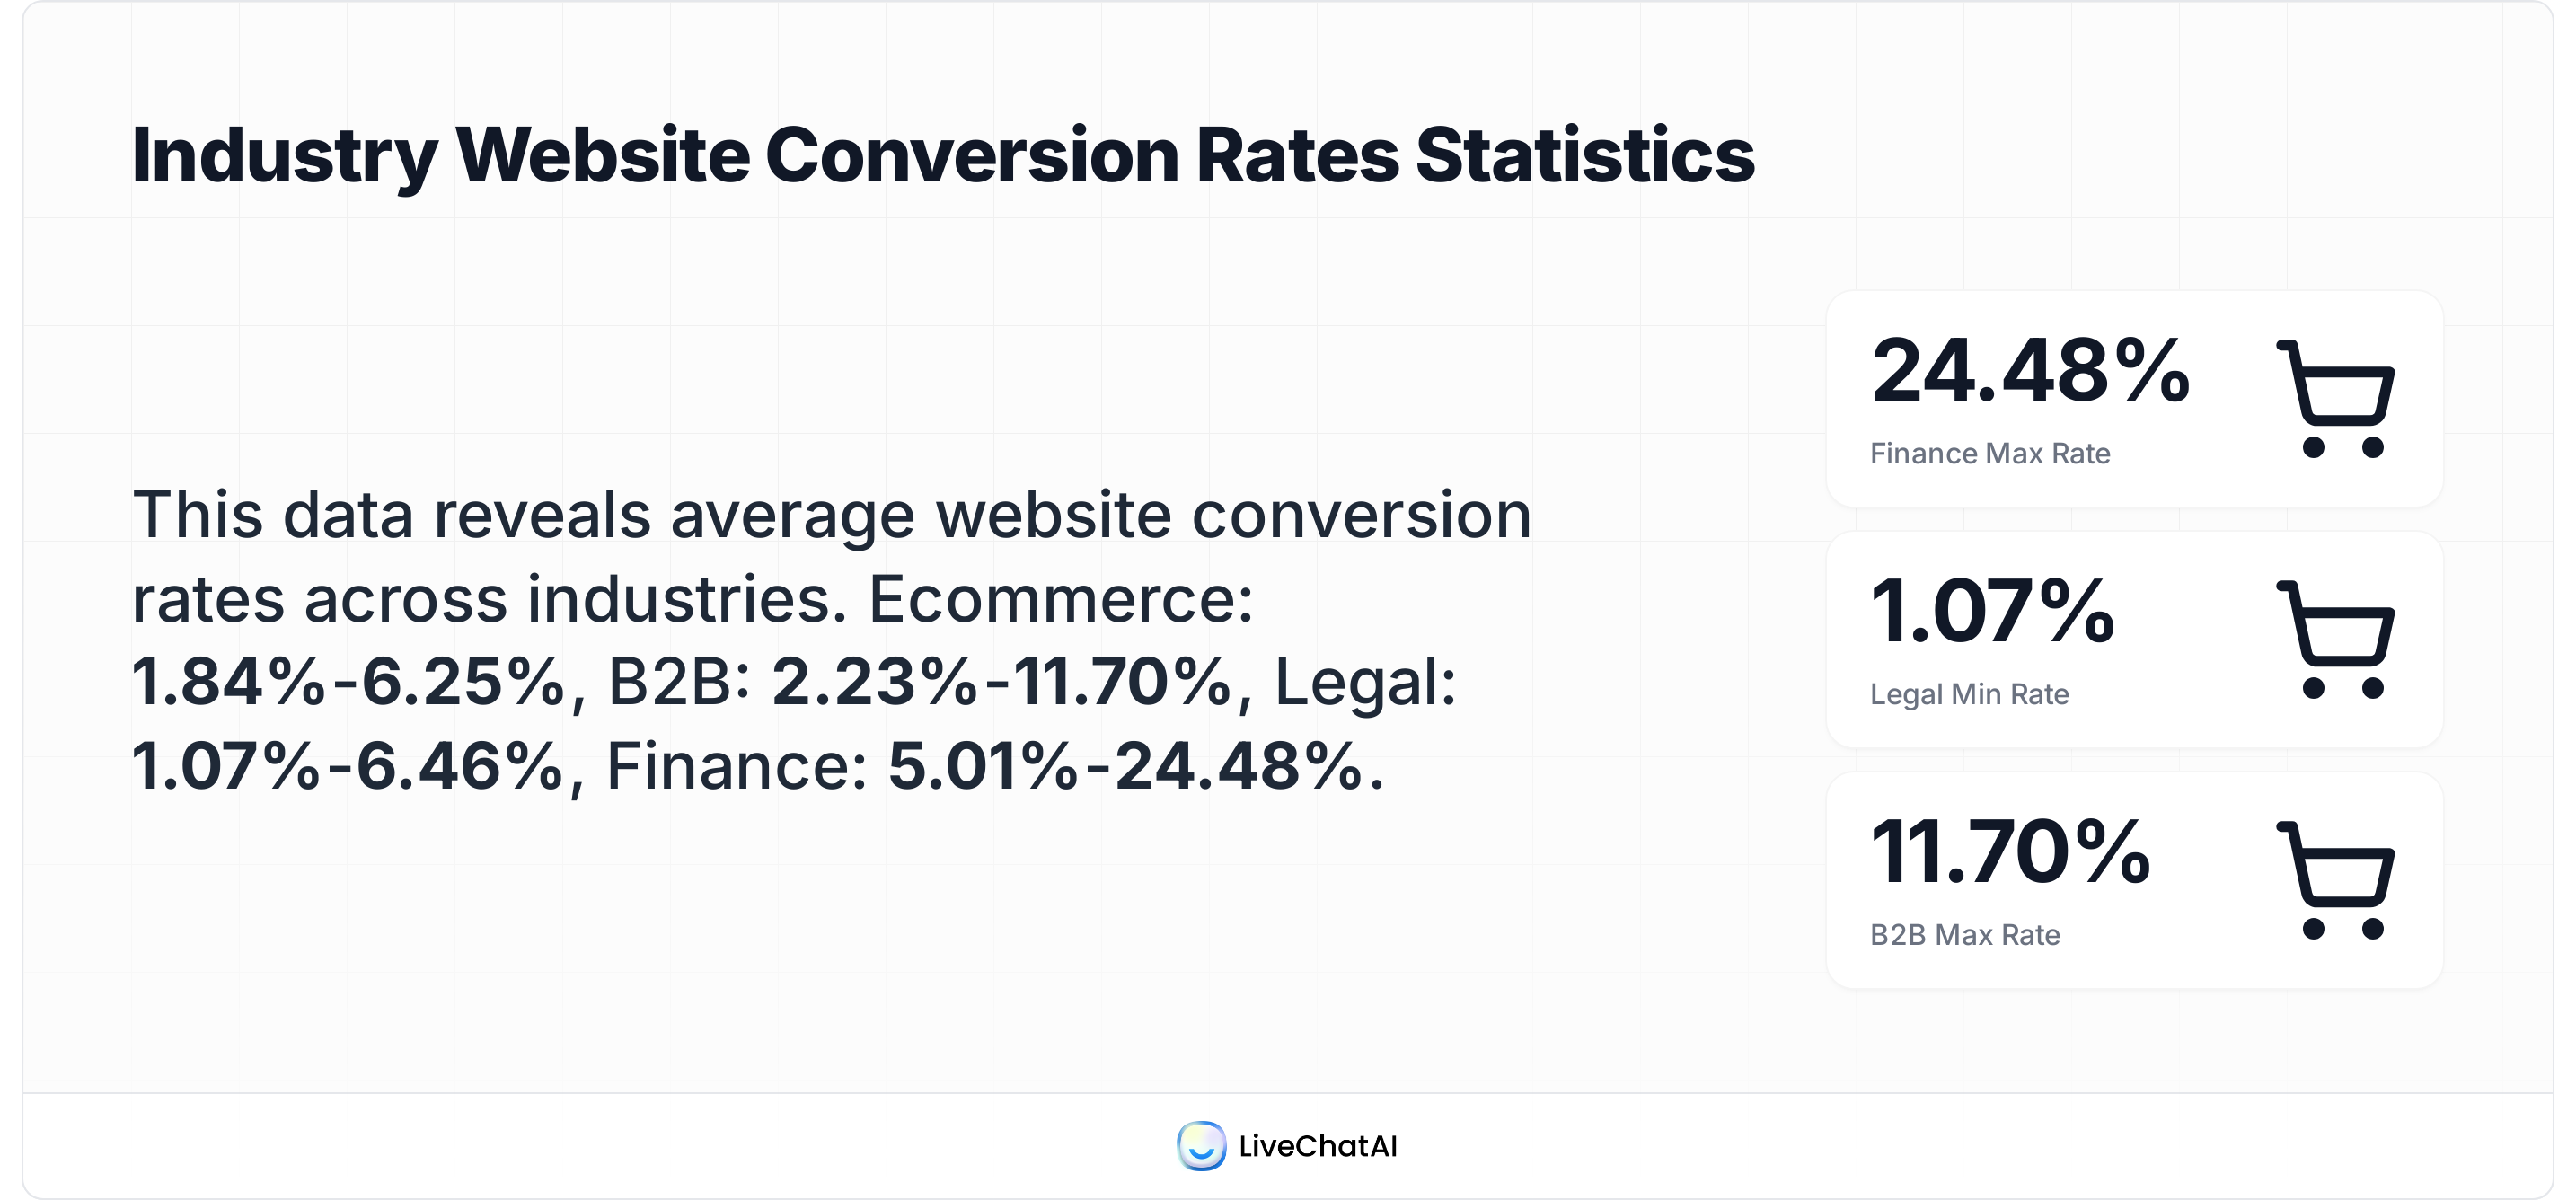
Industry Conversion Rate Benchmarks
Factors Influencing Conversion Rates
Your conversion rate isn't just about your website's design or copy. Six core factors determine whether visitors convert, and some of them are outside your direct control.
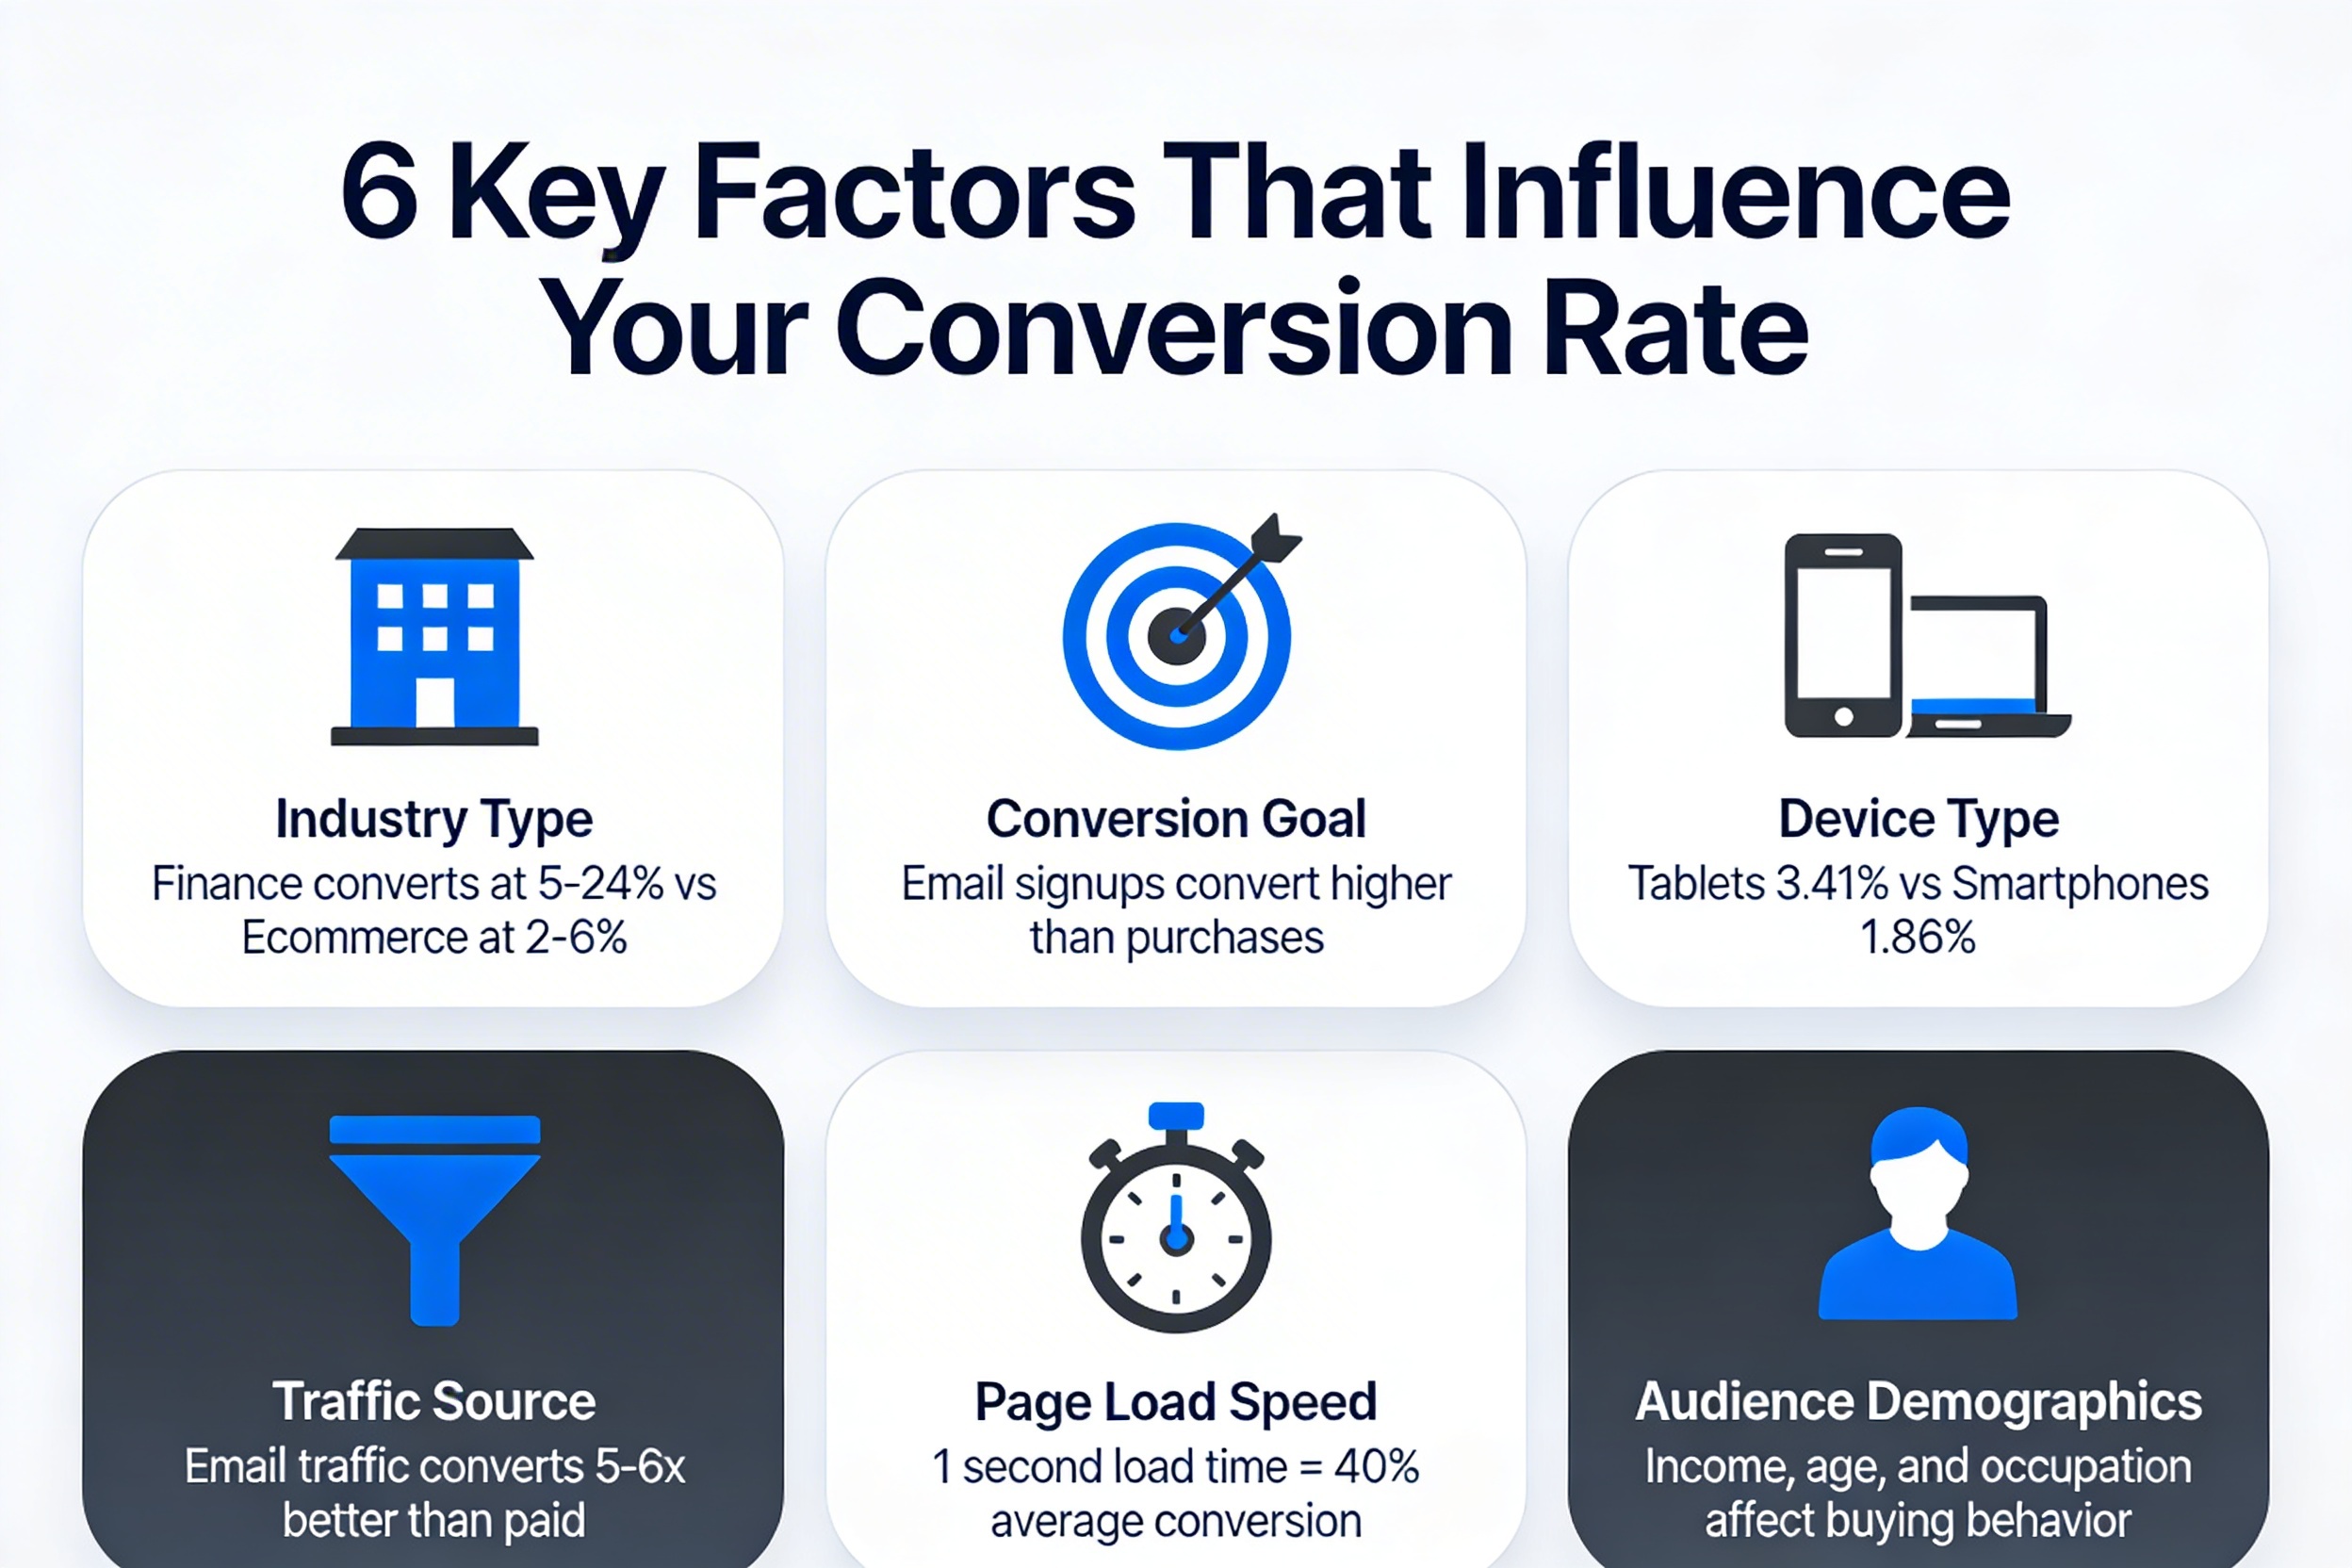
6 Key Factors That Influence Your Conversion Rate
1. Industry and Product Type
A store selling $10 t-shirts will always convert at a higher rate than one selling $2,000 laptops. Higher price points mean longer decision cycles and lower conversion percentages. According to Fyresite, ecommerce conversion rates range from 0.8-1.5% for high-consideration items like furniture to 2.5%+ for everyday consumer goods.
2. Traffic Source
Where your visitors come from dramatically affects how they convert. According to Ruler Analytics, direct traffic converts best with an average rate of 3.3%. Referral traffic follows at 5.4% for ecommerce sites specifically, based on Red Stag Fulfillment data.
Organic search visitors often convert well because they arrive with intent. Paid traffic can convert higher or lower depending on targeting precision. Social media traffic tends to convert lowest because those visitors are often in browse mode, not buy mode.
3. Device Type
Device matters more than most teams realize. Tablets lead with a 3.41% average conversion rate, desktops follow closely, and smartphones lag at 1.86%.
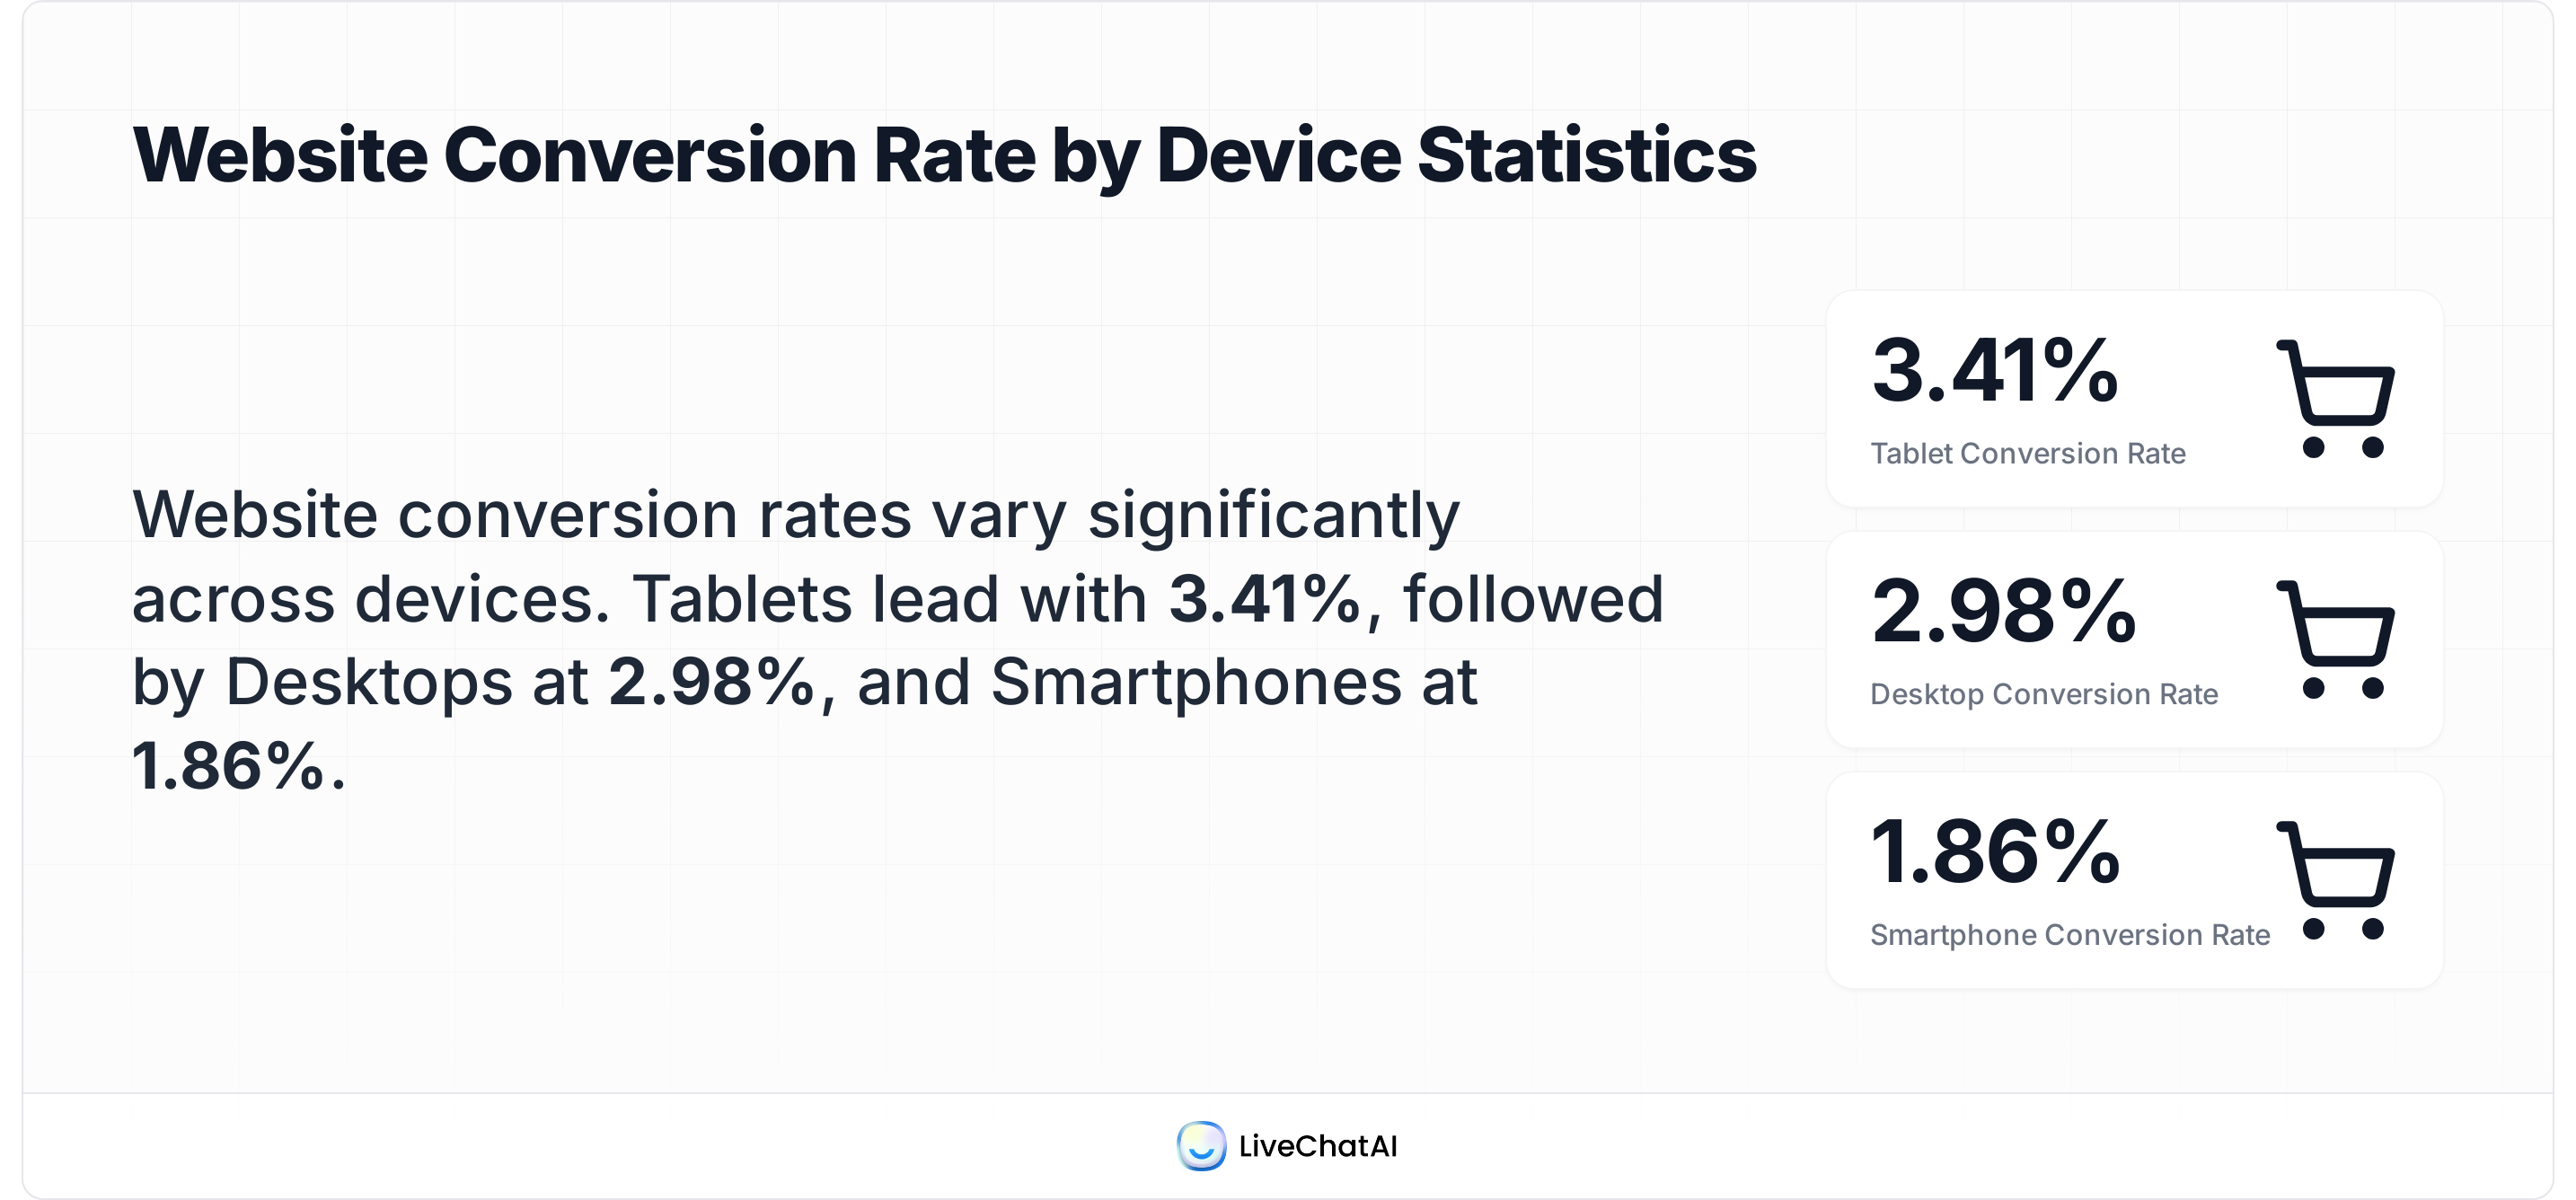
Conversion Rate by Device Type
Mobile visitors often research on their phones and complete purchases on desktop later. If you're only tracking last-click conversions, you might undervalue your mobile experience.
4. Page Load Speed
Speed kills conversions when it's slow. According to Conductor, a 100-millisecond delay can reduce conversion rates by 7%. On the positive side, pages loading in 1 second achieve conversion rates close to 40%, per Email Vendor Selection.
5. User Experience and Trust Signals
Clear navigation, visible security badges, transparent pricing, and professional design all affect whether someone trusts your site enough to convert. We've seen sites increase conversion rates by double digits just by adding social proof elements and simplifying their checkout flow. The Popup Conversion Benchmark Report shows that the right popup placement and timing can push conversion rates above 10-15%.
6. Offer Relevance and CTA Clarity
Your conversion rate reflects how well your offer matches visitor intent. If someone searches "free CRM trial" and lands on a page pushing annual enterprise pricing, they'll bounce. Alignment between search intent, landing page content, and call-to-action determines your ceiling.
Average Website Conversion Rate by Industry
Industry benchmarks give you a reference point, but they aren't targets. Your goal should be to beat your own previous performance, then work toward the top tier for your sector.
Overall Industry Averages
According to Blogging Wizard, the average conversion rate across all industries is 2.9%. The average website conversion rate varies significantly by vertical:
| Industry | Average Conversion Rate |
|---|---|
| Professional Services | 4.6% |
| Finance | 5.01% - 11.19% |
| B2B (overall) | 2.23% - 4.31% |
| Ecommerce (global) | 2.5% - 3% |
| Legal | 1.07% - 4.12% |
| SaaS | 3% - 5% (free-to-paid) |
The range within each industry is wide. That's normal. A well-optimized site in a "low-converting" industry can outperform a neglected site in finance.
Ecommerce Conversion Rates by Sub-Industry
Ecommerce deserves its own breakdown because rates vary sharply by product category. We've compiled the latest ecommerce conversion rate data below:
| Sub-Industry | Average Conversion Rate |
|---|---|
| Food and Beverage | 6.11% |
| Health and Wellbeing | 3.04% |
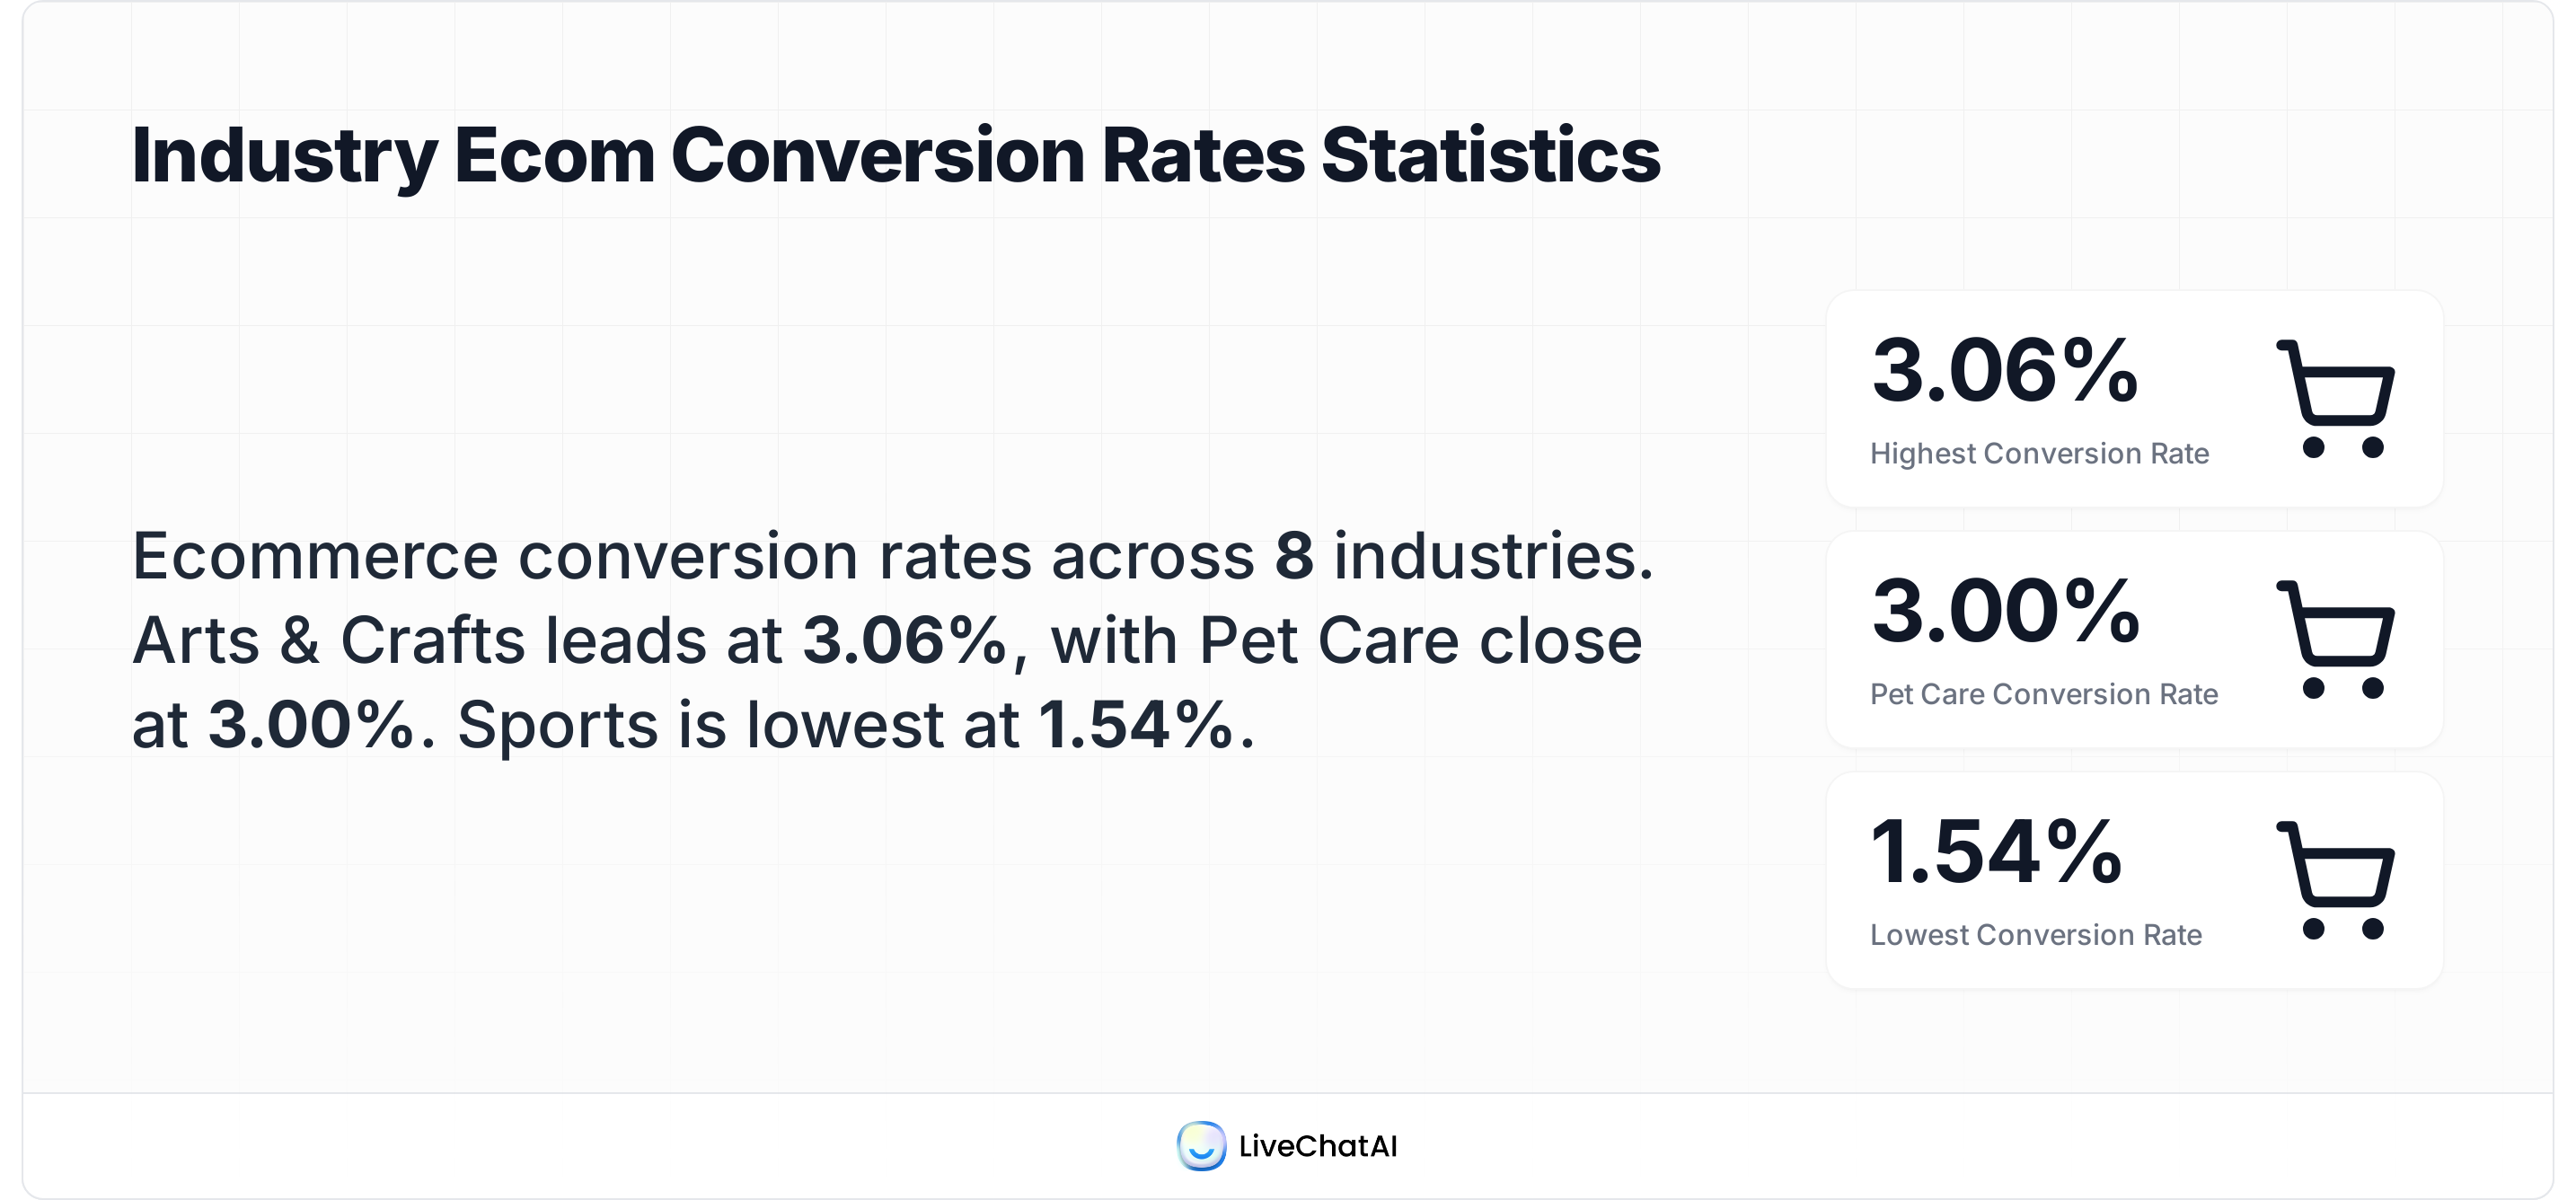
| Arts and Crafts | 3.06% |
| Pet Care | 3% |
| Kitchen and Home Appliances | 2.86% |
| Apparel and Fashion | 2.8% |
| Food and Drink | 2.06% |
| Cars and Motorcycling | 1.59% |
| Sports and Recreation | 1.54% |
| Home Accessories and Giftware | 1.06% |
| Electrical and Commercial Equipment | 0.78% |
| Baby and Child | 0.39% |
Ecommerce Conversion Rate by Sub-Industry
Food and Beverage leads at 6.11% (sourced from Red Stag Fulfillment), likely because these are low-cost, repeat purchases with short decision cycles. Baby and Child products sit at the bottom at 0.39%, where parents research extensively before buying.
If you run a Shopify store, keep in mind that platform-specific benchmarks differ. Shopify's average sits around 1.4%, with top stores converting at 4.7% or above.
Conversion Rates by Traffic Source
Traffic source benchmarks help you understand which channels deserve more investment:
Email's performance is worth highlighting. If you're not building an email list and optimizing your form conversion rates, you're leaving your highest-converting channel underutilized.
B2B Conversion Rate Benchmarks
B2B conversion rates follow different patterns than B2C because the buying process involves more stakeholders, longer timelines, and higher stakes. Here's what the data shows for 2026.
B2B Website Conversion Benchmarks
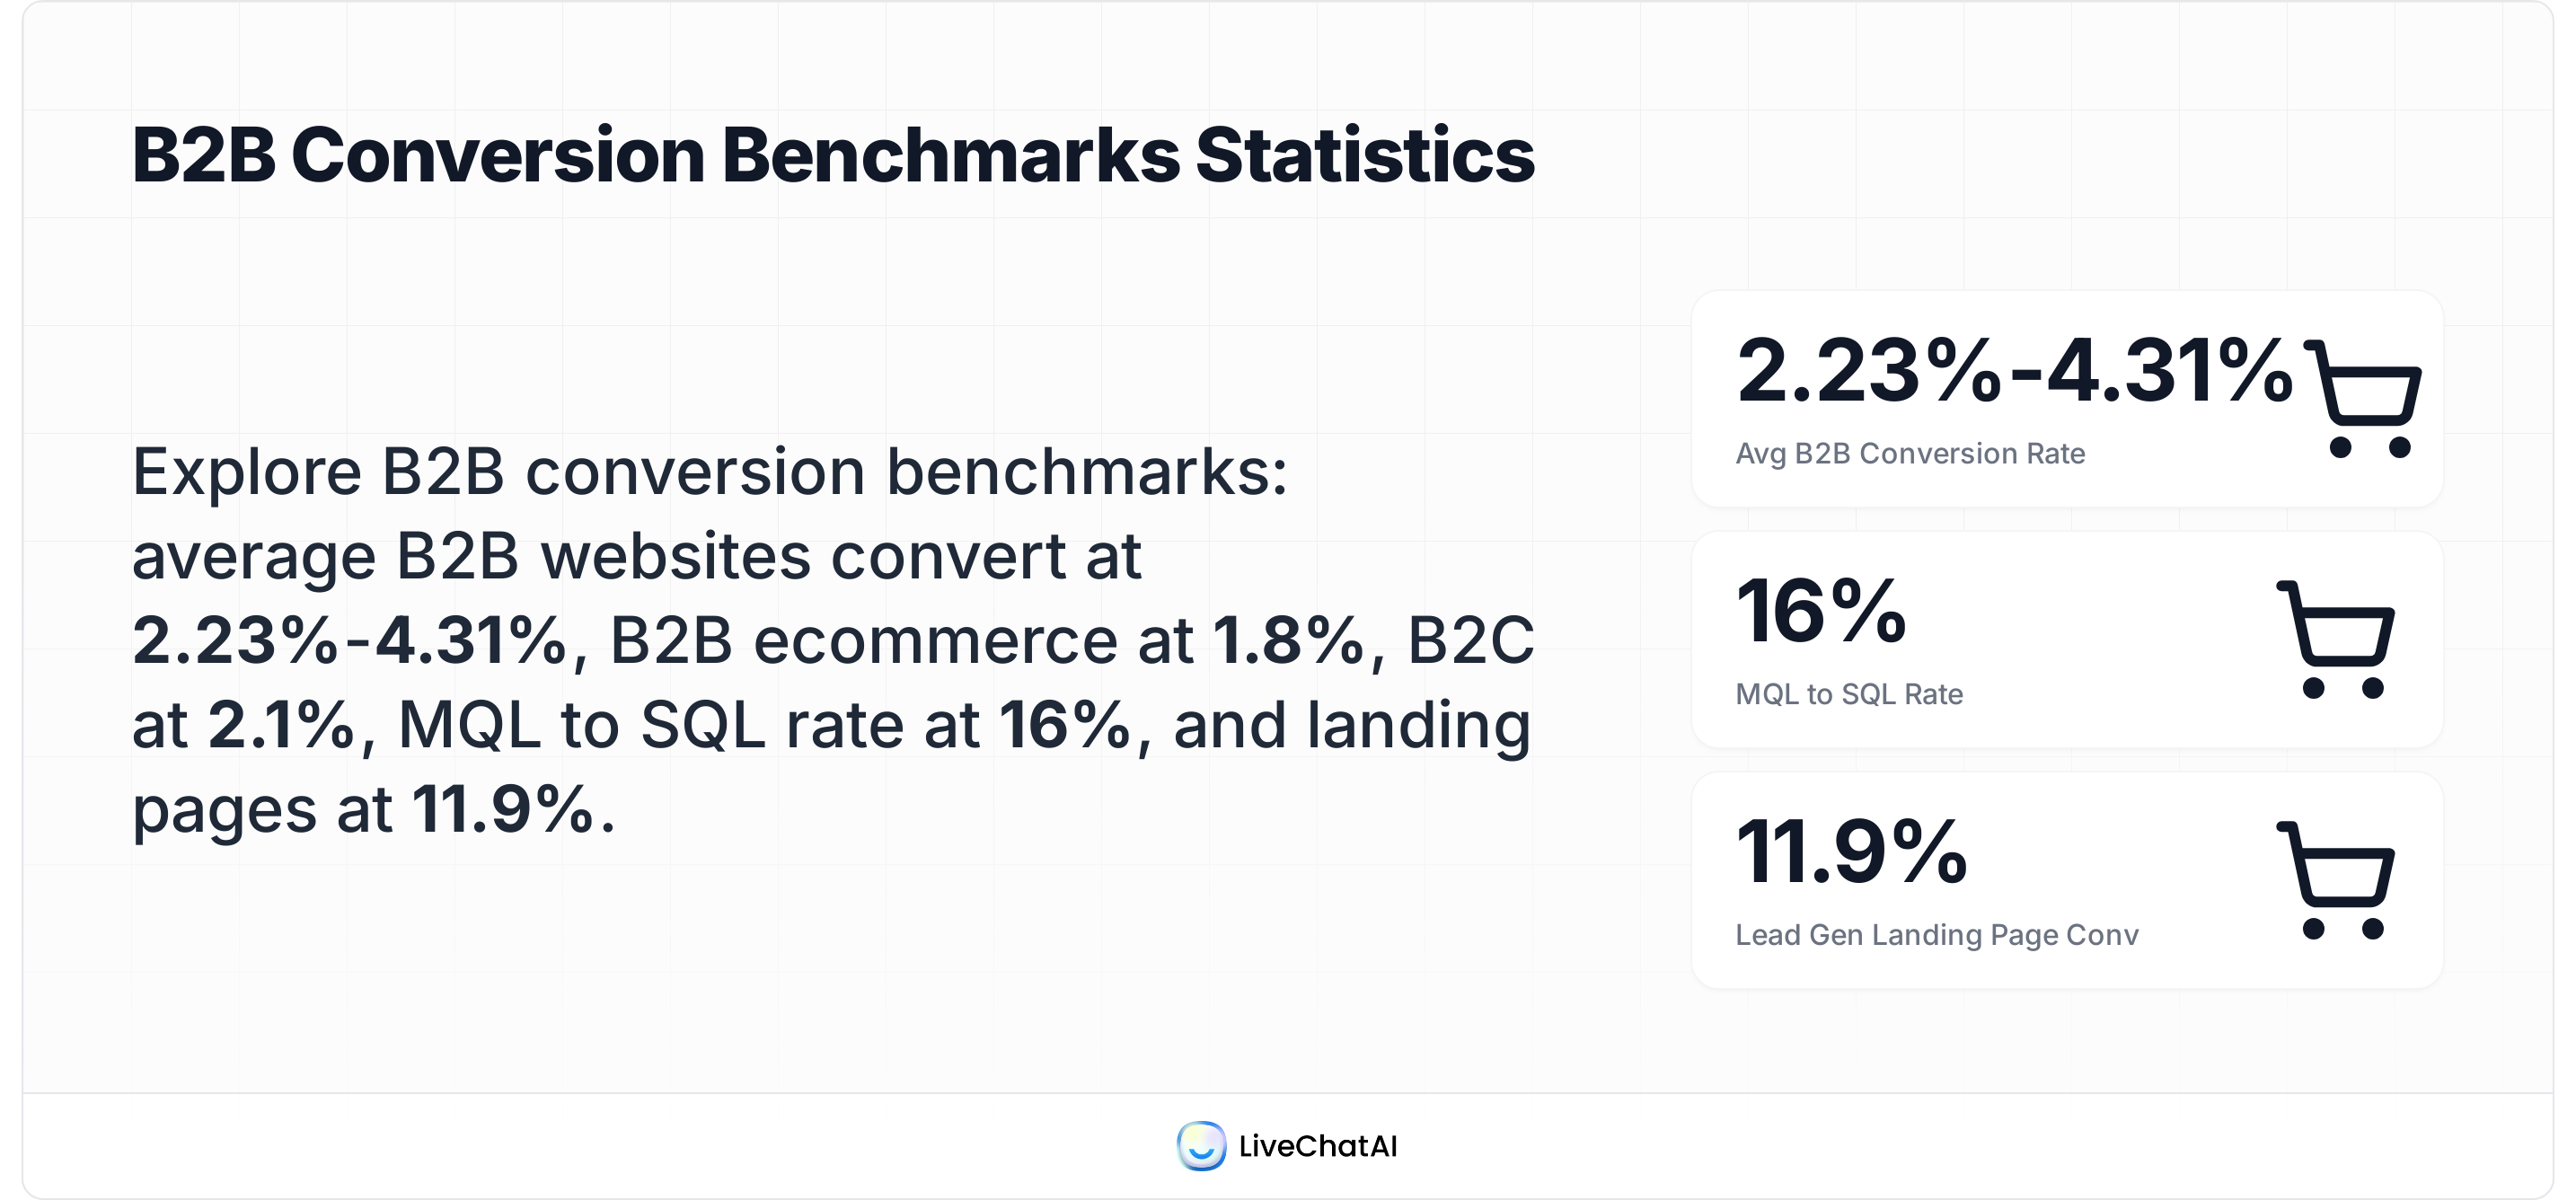
According to Lead Forensics, the average conversion rate for B2B websites falls between 2.23% and 4.31%. That range accounts for differences in how B2B companies define a conversion (demo request vs. contact form vs. free trial).
| B2B Metric | Average Rate | Source |
|---|---|---|
| B2B website overall | 2.23% - 4.31% | Lead Forensics |
| B2B ecommerce | 1.8% | Ruler Analytics |
| B2C websites | 2.1% | The Frank Agency |
| Lead generation landing pages | 11.9% | Blogging Wizard |
| MQL to SQL conversion | 16% | Snov.io |
| SaaS free-to-paid (good) | 3% - 5% | Growth Unhinged |
| SaaS free-to-paid (great) | 8% - 12% | Growth Unhinged |
A few things stand out. B2B ecommerce converts at just 1.8%, per Ruler Analytics. That's lower than most B2C ecommerce because B2B purchases often require procurement approval and involve larger order values.
Lead generation landing pages tell a different story at 11.9%. When you're asking for an email address instead of a credit card, the bar is lower and conversion rates reflect that.
For SaaS companies specifically, Growth Unhinged reports that 3%-5% is a good free-to-paid conversion rate for freemium products, and 8%-12% is great. If you're below 3%, there's a gap between your free product experience and the value perception of your paid tier.
Check out digital marketing statistics for more B2B benchmarks across channels.
How to Calculate Your Website Conversion Rate
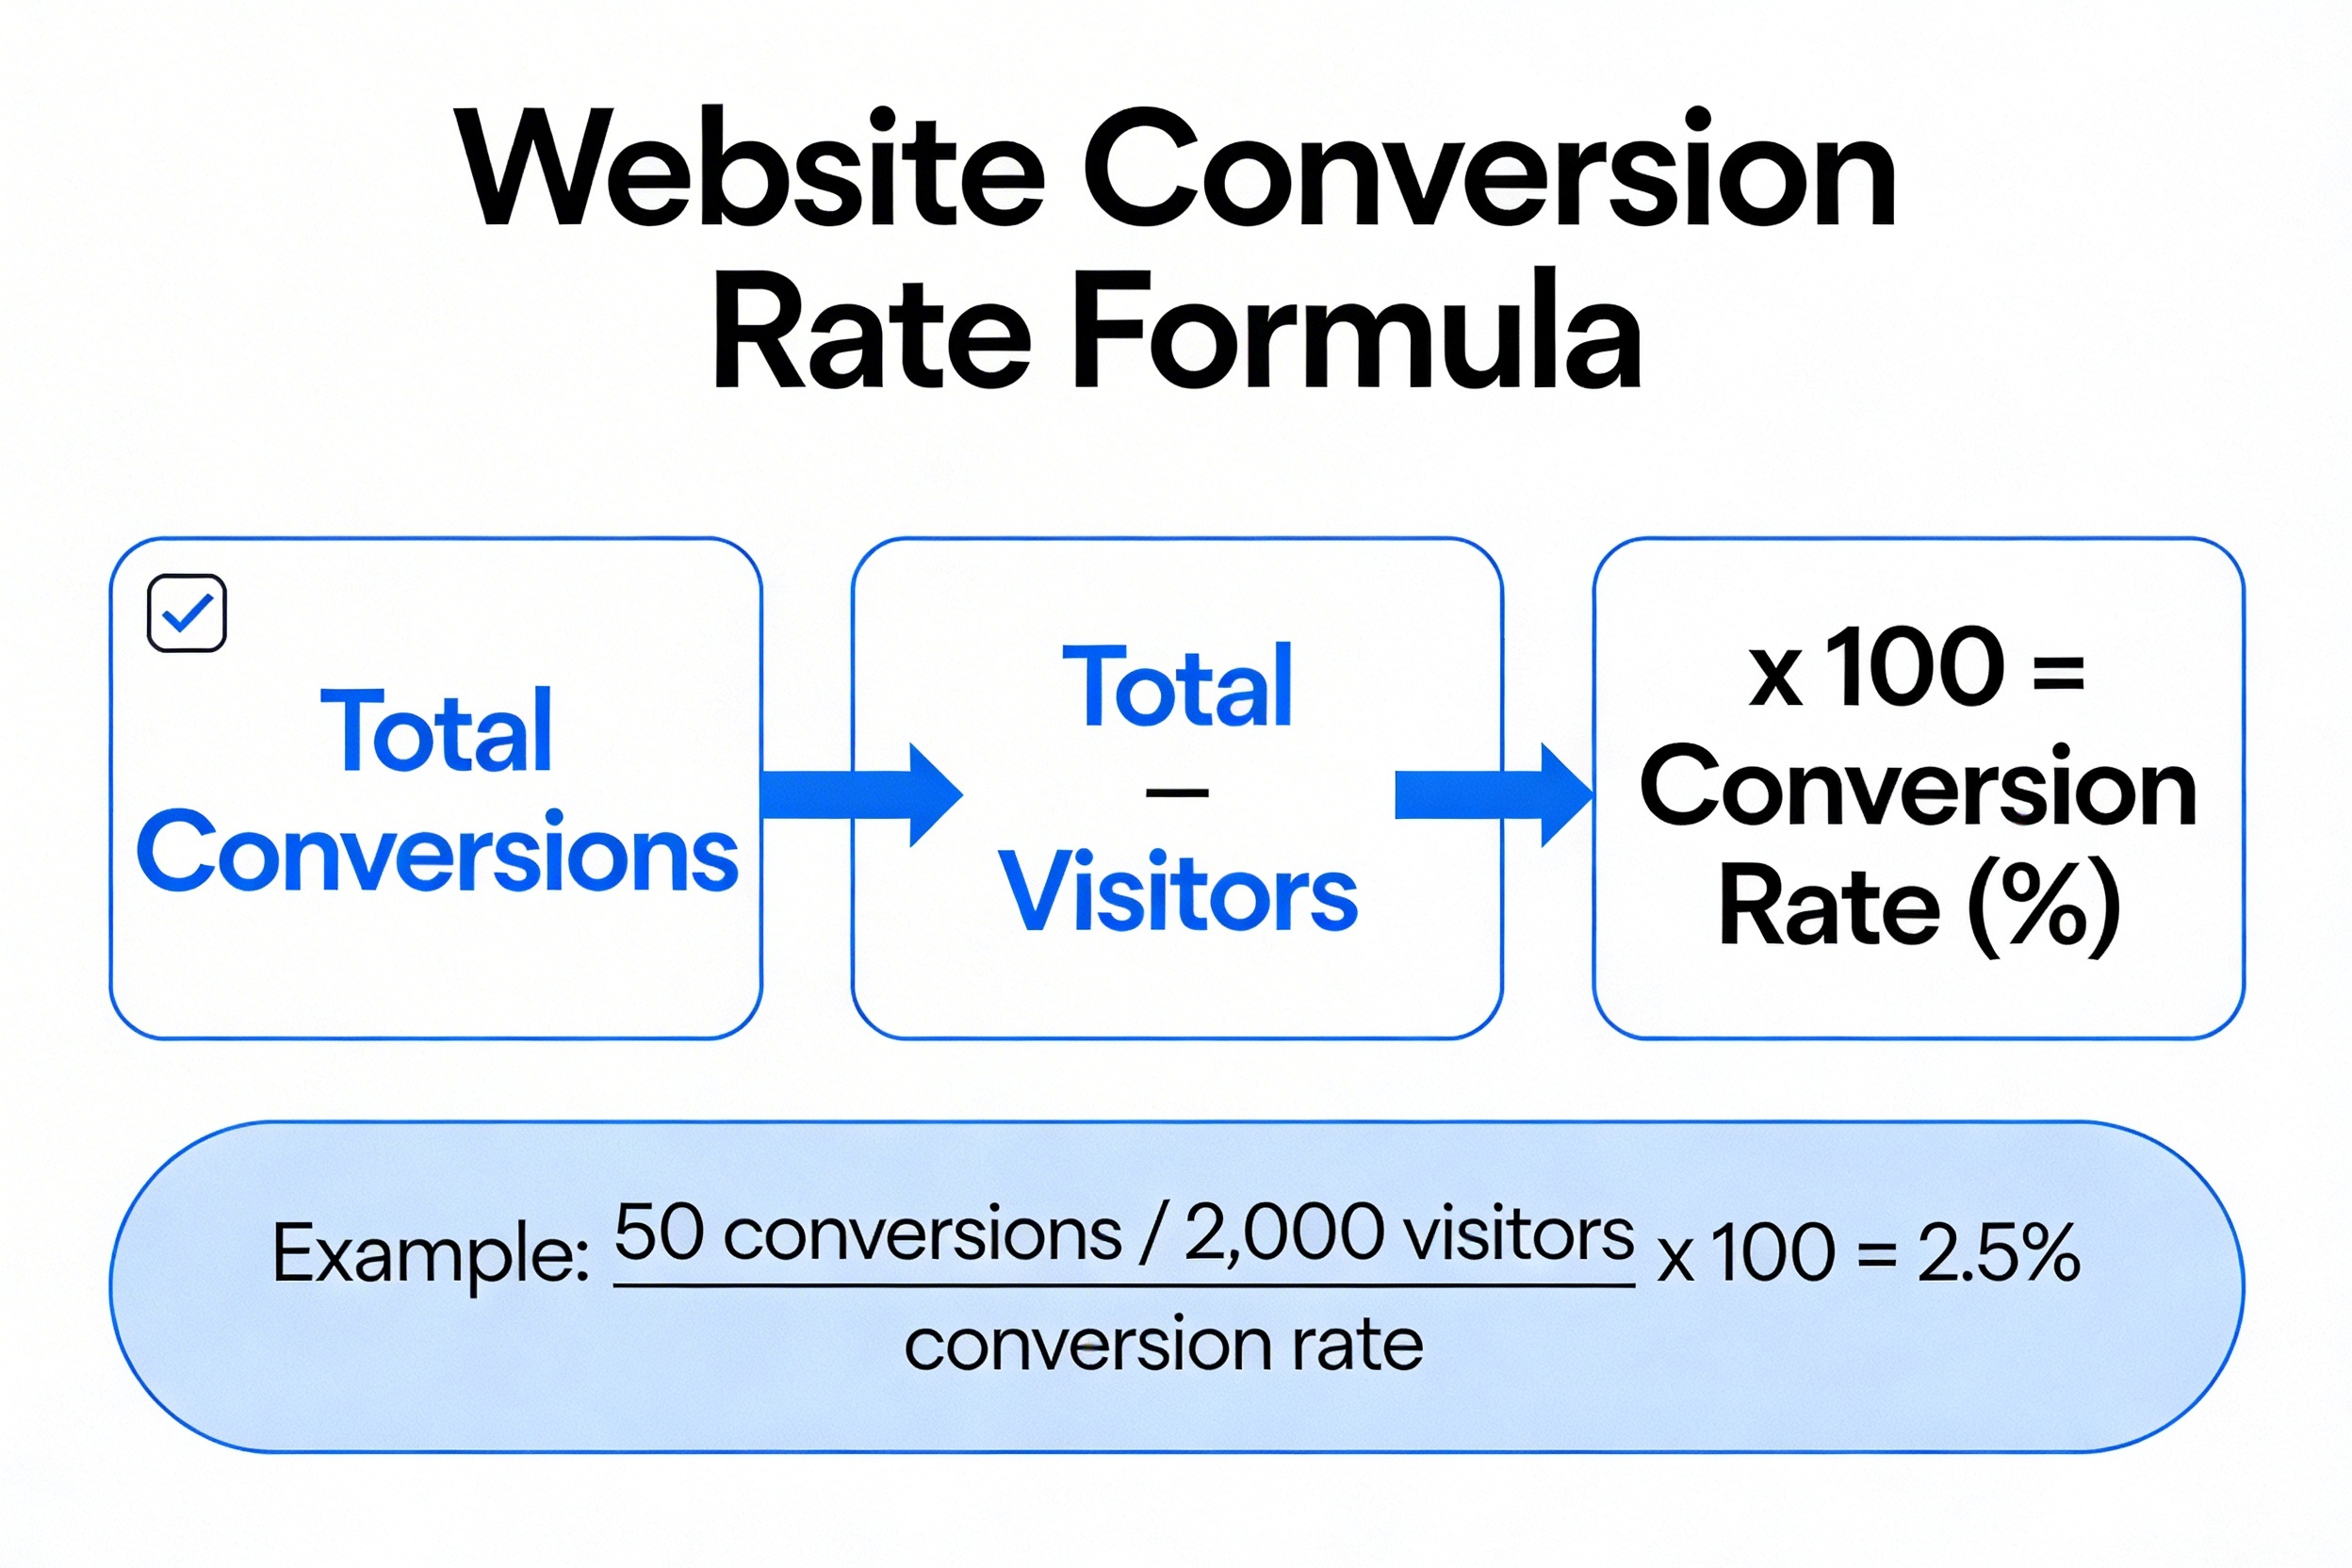
Calculating your website conversion rate takes about 10 seconds once you have the numbers. Here's the formula:
Website Conversion Rate Formula
Say your site had 10,000 visitors last month and 350 of them completed a purchase. Your conversion rate is 350 / 10,000 x 100 = 3.5%.
Two Ways to Calculate
If you have multiple conversion goals on your site (ebook downloads, demo requests, purchases), you can calculate this two ways:
Both approaches have value. Per-goal rates help you optimize specific pages. Sitewide rates help you track overall performance trends and report to leadership.
What Your Rate Tells You
A high conversion rate generally means three things: you're attracting the right audience, your messaging connects with that audience, and you've made it easy to take action. A low rate suggests a breakdown in at least one of those areas.
Don't calculate it once and move on. Track it weekly. Compare month over month. Segment by traffic source, device, and landing page. The number alone is less useful than the trend and the context. You can use Popupsmart's CRO checker to identify what might be dragging your rate down.
Tips to Improve Your Conversion Rate
Improving your conversion rate doesn't require a full site redesign. Based on real case studies and proven benchmarks, here are the highest-impact changes you can make.
1. Speed Up Your Site
Page speed is the foundation. According to Conductor, Vodafone saw 8% more sales after optimizing Core Web Vitals. Yelp boosted conversions by 15% by improving First Contentful Paint. Start with your Core Web Vitals scores and fix the biggest bottlenecks first.
2. Simplify Your Forms
Every extra form field costs you conversions. SaaS companies that simplified their signup forms doubled trial signups, per SiteTuners. Ask only for what you need. For top-of-funnel offers, an email address is enough. Learn more in our guide on increasing form conversion rates.
3. Use Action-Oriented Headlines and Copy
According to Picreel, switching to action-oriented headlines increased conversion rates by 38.3%. Your headlines should tell visitors what they'll get, not just describe your product. Focus on outcomes, not features.
4. Add Trust Signals Where They Matter
Place trust badges, customer logos, testimonials, and security certifications near your CTAs and checkout. Addressing buyer concerns directly increases conversions by 80%, per Email Vendor Selection.
5. Personalize Your CTAs
Generic CTAs underperform. Personalized CTAs perform 202% better than default versions. Segment your visitors and show them offers relevant to their behavior, location, or funnel stage. Popupsmart's smart popups let you target specific visitor segments with personalized offers. See what the top CRO experts recommend for personalization strategies.
6. Test One Variable at a Time
A/B testing results compound. CXL documented a case where Truckers Report improved conversions by 79.3% by changing a single word in their headline (CXL). Small, data-driven changes beat big redesigns because you know exactly what caused the lift.
7. Optimize for Mobile Separately
With smartphones converting at 1.86% compared to tablets at 3.41%, your mobile experience needs its own optimization strategy. Don't just shrink your desktop site. Redesign forms, CTAs, and navigation specifically for thumb-friendly interaction. For Shopify stores, mobile optimization is especially important since most traffic now comes from phones.
8. Use Exit-Intent Popups
Before a visitor leaves, an exit-intent popup can recover a portion of lost conversions. One case study from Conversion Rate Store showed DoYogaWithMe achieved a 173% conversion rate uplift using strategic banners and exit-intent popups. The key is timing and relevance: offer something valuable, not just another generic discount.
Methodology and Sources of Conversion Rate Data
These statistics were compiled from 20+ sources including industry reports from Ruler Analytics, First Page Sage, and Unbounce, company-published benchmarks from Adobe, Forbes, and WordStream, and community data from Reddit and HubSpot. All data points are from 2024-2026 unless otherwise noted.
How we verified: Each statistic was cross-referenced against the original source URL. Where multiple sources reported different figures for the same metric (such as overall average conversion rate), we presented the range rather than choosing one number. Case study data was verified by checking original publisher attribution. Older data points were flagged with their year of origin.
Frequently Asked Questions
What is a good conversion rate for a website?
A good conversion rate for a website is between 2% and 5% for most industries. Anything above 5% is strong, and rates above 10% are exceptional. The specific threshold depends on your industry, traffic source, and what counts as a conversion. Finance websites regularly hit 10%+, while ecommerce sites typically range from 2% to 4%. Rather than chasing a single number, focus on outperforming your own historical average and the median for your specific sector.
Is a 50% conversion rate good?
A 50% conversion rate is extremely unusual for a website's overall traffic. If you're seeing this number, it likely applies to a very narrow funnel, like email subscribers clicking a limited-time offer or returning customers on a reorder page. For a landing page, 50% is outstanding. Later, a social media management platform, achieved a 60% conversion rate on specific landing pages through heavy optimization, according to Unbounce. For a full-site metric, though, double-check your tracking setup because something may be misconfigured.
Is a 7% conversion rate good?
Yes, a 7% conversion rate is above average for virtually every industry. It places you well above the 2.9% cross-industry average. For ecommerce, 7% would put you in the top tier. For B2B websites, it's more than double the median. The average Google Ads conversion rate is 7.04%, so if you're hitting 7% from organic traffic, you're performing at paid-traffic levels without the ad spend. Keep optimizing, but you're doing well.
Is a 2.5% conversion rate good?
A 2.5% conversion rate is average. It's not bad, and it's not a reason to celebrate. It sits right at the global ecommerce average of 2.5-3% and slightly below the cross-industry average of 2.9%. If you're in ecommerce, you're right in line with your peers. If you're in finance or professional services, there's room for improvement. The question isn't whether 2.5% is "good" but whether it's where you should be given your industry, traffic quality, and offer strength. An ecommerce CRO audit can help you identify where you're leaving conversions on the table.
What is the average B2B website conversion rate in 2026?
The average B2B website conversion rate in 2026 ranges from 2.23% to 4.31%, depending on the source and how "conversion" is defined. B2B ecommerce specifically converts at about 1.8%. Lead generation pages perform much better, with the average lead gen landing page converting at 11.9%. For SaaS specifically, a 3%-5% free-to-paid rate is considered good, and 8%-12% is great. The MQL-to-SQL conversion rate averages 16% across industries.
How does industry affect website conversion rates?
Industry is one of the strongest predictors of conversion rate. Finance sites average 11.19% at the median tier while ecommerce sites average 3.71%. This gap exists because of buyer intent, product complexity, and purchase price. A visitor comparing mortgage rates is far more motivated than someone browsing t-shirts. Within ecommerce alone, sub-industry rates range from 0.39% (baby products) to 6.11% (food and beverage). Always benchmark against your specific vertical, not generic cross-industry averages.

How would you rate your experience with this article? 😊