E-commerce Conversion Rate Statistics for 2026
E-commerce conversion rate is the % of visitors completing a desired action (usually a purchase); 2%+ is generally “good,” with averages ~2–4% and varying by industry, device, country, and traffic source. It covers benchmarks and CRO tips like free shipping, better media, cart recovery, simpler checkout, and coupons.
It's not a secret that as an online store owner or marketer, you've put in a lot of work just to build and launch your e-commerce business.
The average ecommerce conversion rate sits between 2.5% and 3% globally in 2026, with benchmarks ranging from 0.9% in luxury goods to 6.11% in food and beverage. Below, 30+ sourced statistics break down conversion rates by industry, device, region, and traffic source.
What Is an Ecommerce Conversion Rate?
• The global average eCommerce conversion rate is 2.79% across all sectors — Dynamic Yield
• Food and beverage leads all industries at 6.11% conversion rate — Red Stag Fulfillment
• Desktop converts at 2.36% compared to mobile's 1.49% on Google Shopping — Store Growers
• Product personalization delivers a 150% conversion uplift over static product flows — GoKickflip
• In December 2025, IRP reported the average conversion rate dropped to 1.99%, down from 2.18% a year earlier — Speed Commerce
An ecommerce conversion rate measures the percentage of website visitors who complete a purchase within a given period. It's the single most-watched metric for online stores because it directly connects traffic investment to revenue output.
Conversions aren't limited to purchases. Email signups, add-to-cart actions, and wishlist additions all count as micro-conversions that feed your broader conversion rate picture. But when people say "ecommerce conversion rate," they almost always mean completed transactions.
Here's the formula:
Ecommerce Conversion Rate = (Number of Transactions / Total Sessions) x 100%
If your store gets 10,000 sessions and 250 orders in a month, your conversion rate is 2.5%. Google Analytics defines it as "the ratio of transactions to sessions, expressed as a percentage."
That formula looks simple. The hard part is knowing whether your number is good, bad, or average for your specific vertical, device mix, and traffic sources. The statistics below break that down.
What Is the Average Ecommerce Conversion Rate in 2026?
Source: Multiple industry reports, 2025-2026
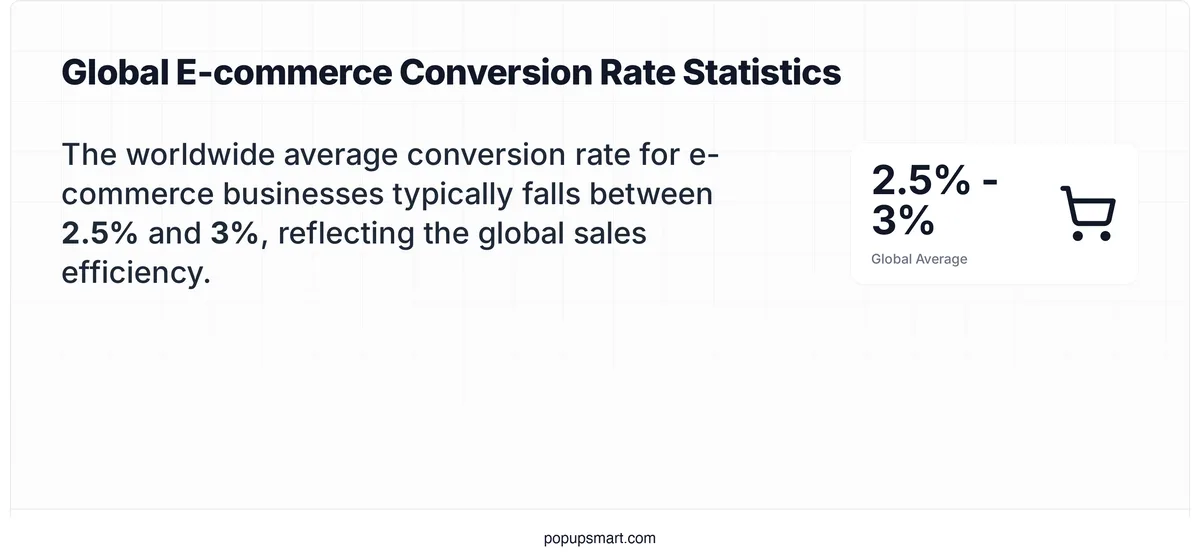
The global average ecommerce conversion rate falls between 2% and 3%, depending on which benchmark source you reference. That range has barely moved in two decades, despite massive investments in site speed, UX, and personalization.
According to Dynamic Yield, the global average eCommerce conversion rate is 2.79% across all sectors.
This benchmark aggregates real-time data from thousands of ecommerce sites across multiple regions. It's one of the most frequently cited figures in the industry because Dynamic Yield updates it monthly, giving marketers a current snapshot rather than a lagging annual average.
If your store converts below 2%, you're leaving money on the table relative to the global average. Start by auditing your product pages and checkout flow before investing in more traffic. A store converting at 1.5% that doubles its conversion rate effectively doubles revenue without spending a penny more on ads.
According to Speed Commerce, IRP reported the average conversion rate dropped to 1.99% in December 2025, down from 2.18% in December 2024.
A 0.19 percentage point decline might sound small, but at scale it represents billions in missed revenue globally. Seasonal factors partly explain this dip (holiday shopping concentration shifts year to year), but the broader pattern points to growing competition for buyer attention across more channels.
Tip: Track your own month-over-month conversion rate in Google Analytics, not just year-over-year. Seasonal dips are normal, but a persistent downward trend over three or more months signals a UX or competitive positioning problem that won't fix itself.
One thing worth noting: these averages blend high-performing stores with brand-new shops that haven't optimized anything. According to Nector, high-performing stores regularly exceed 5%. The gap between average and top performers tells you exactly how much room exists for improvement.
Ecommerce Conversion Rate Benchmarks by Industry
Source: Red Stag Fulfillment, 2025
Industry benchmarks matter more than global averages. A 2% conversion rate means very different things for a furniture retailer and a pet food subscription service. The products, price points, and purchase cycles create wildly different baseline expectations.
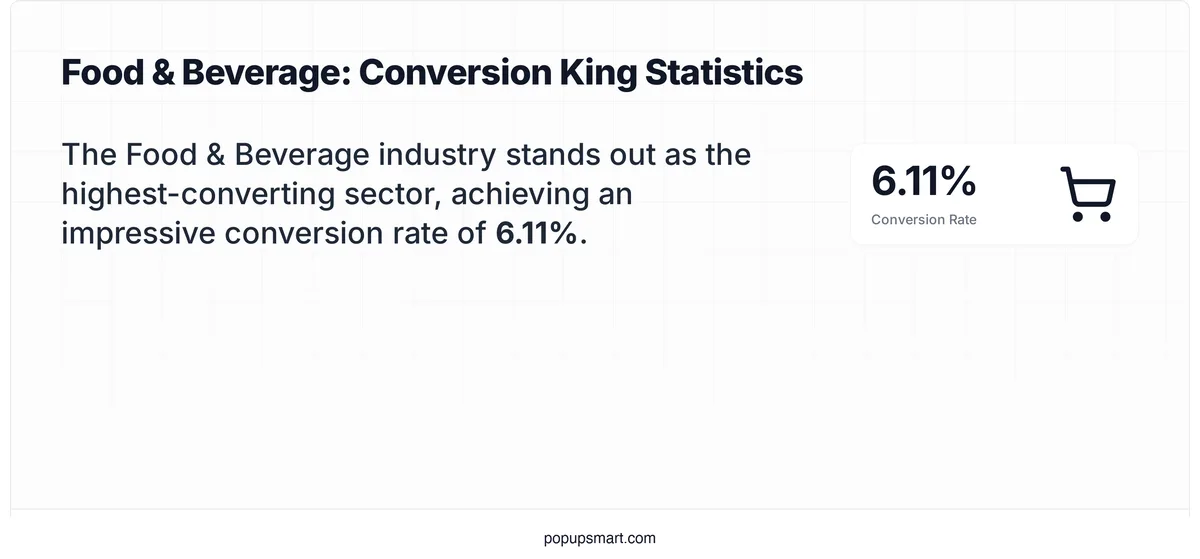
According to Red Stag Fulfillment, food and beverage leads all ecommerce industries at 6.11% conversion rate.
This figure makes sense given the purchase dynamics: food is a repeat-buy, low-consideration category. Customers already know what they want, prices are relatively low, and the "try before you buy" anxiety barely exists. Compare that to furniture or luxury jewelry, where every purchase involves research, comparison, and price sensitivity.
What to do: Benchmark your store against your own industry, not global averages. A 2% rate in luxury jewelry puts you above the median, while the same rate in food and beverage suggests serious conversion friction.
Here's how conversion rates break down across major ecommerce verticals:
| Industry | Average Conversion Rate | Source |
|---|---|---|
| Food and Beverage | 6.11% | Red Stag Fulfillment |
| Health and Beauty | 3.3% | Adobe |
| Fashion and Apparel | 2.7% | Adobe |
| Entertainment | 2.5% | Adobe |
| Household Goods | 2.1% | Adobe |
| Electronics | 1.9% | Adobe |
| Furniture | 0.8–1.5% | Fyresite |
| Luxury and Jewelry | 0.9% | Dynamic Yield |
According to Adobe's ecommerce benchmark report, the top-performing verticals consistently include health, beauty, and food categories, where lower average order values and repeat purchasing behavior drive higher conversion rates.
Ecommerce Conversion Rate Statistics by Device
Device type creates one of the sharpest conversion rate gaps in ecommerce. Despite mobile traffic dominating total sessions for most stores, desktop still converts at significantly higher rates. Understanding this gap helps you allocate optimization effort where it'll move the needle most.
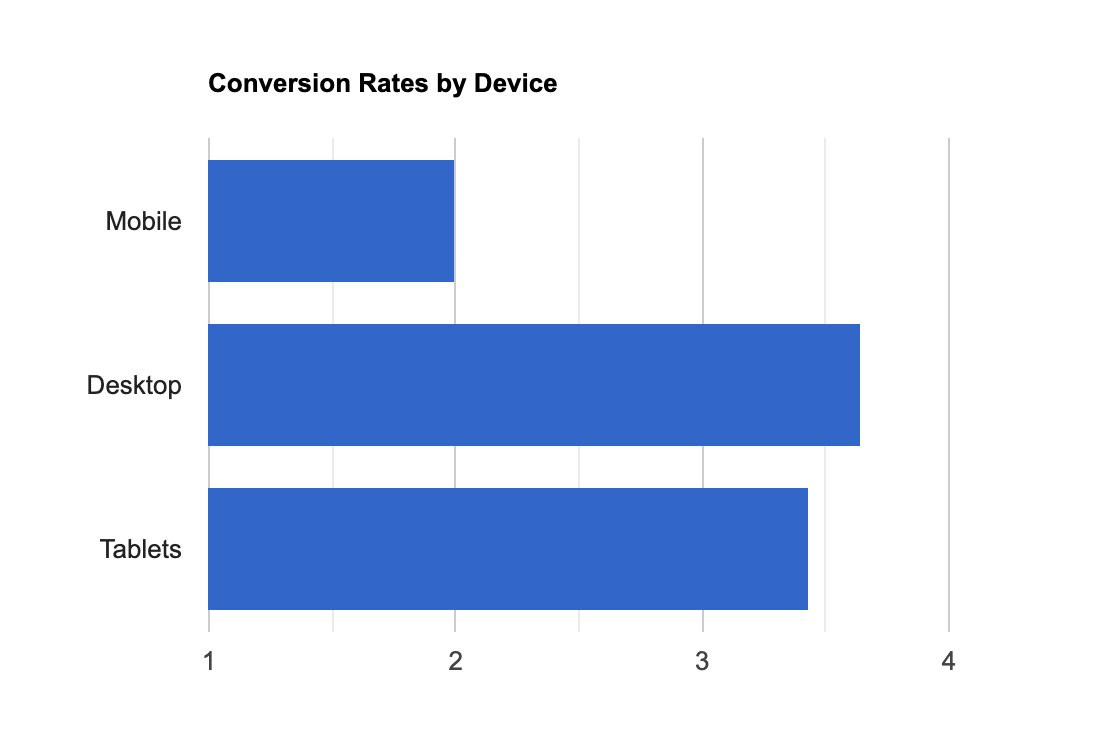
Ecommerce conversion rates by device
According to Store Growers, Google Shopping conversion rates by device break down as: desktop 2.36%, tablet 2.11%, and mobile 1.49%.
The mobile-to-desktop conversion gap is roughly 37%. That's not a minor difference. For a store doing $1 million monthly from desktop, the same traffic volume on mobile would generate around $630,000, assuming similar average order values. The gap represents a massive optimization opportunity.
Pro tip: Run your own device-specific conversion analysis in Google Analytics. If your mobile conversion rate lags more than 40% behind desktop, prioritize mobile checkout simplification: auto-fill forms, digital wallet integration (Apple Pay, Google Pay), and reducing the total number of form fields.
Mobile now accounts for roughly 71% of all ecommerce traffic. That means most of your visitors experience your store on a screen that converts significantly worse. This tension between traffic share and conversion rate is the defining challenge for ecommerce in 2026.
Why Mobile Shoppers Convert at Lower Rates
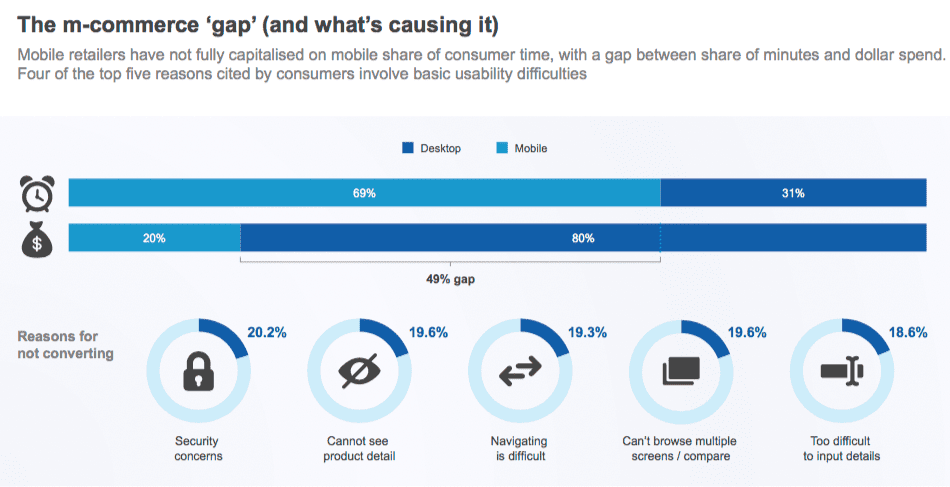
Factors behind lower mobile conversion rates
Mobile conversion friction comes from three sources. Small screens make product comparison harder. Typing payment and shipping details on a phone is tedious (and error-prone). And many shoppers use mobile for browsing and research, then switch to desktop to buy.
For Shopify stores specifically, mobile conversion rates tend to track even lower than the industry average because many Shopify merchants are smaller businesses with less optimized mobile experiences. If you're on Shopify, adding mobile-responsive multi-step forms and exit-intent popups designed for touch screens can help close the gap.
Ecommerce Conversion Rate Statistics by Country
Geography shapes ecommerce conversion rates as much as industry does. Payment infrastructure, shipping logistics, consumer trust in online retail, and purchasing power all differ dramatically across borders.
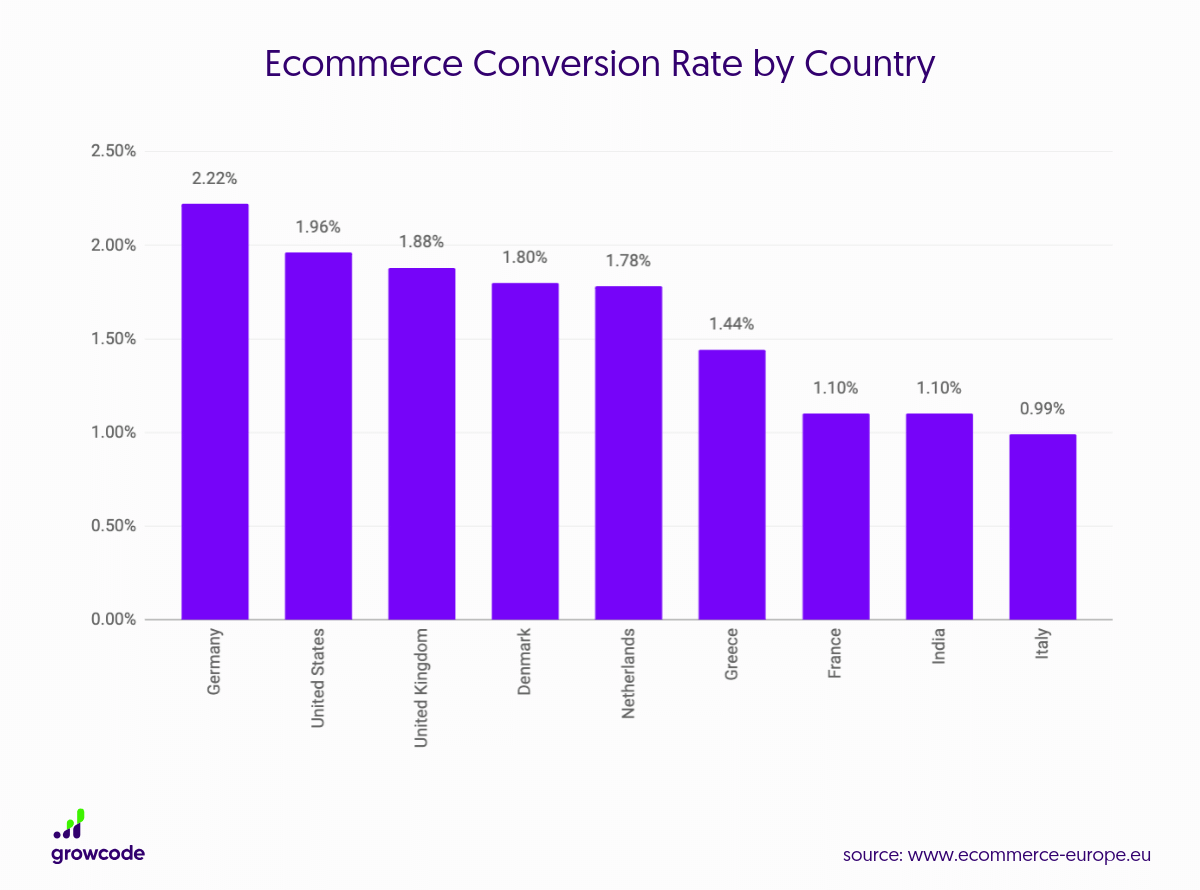
Source: Ecommerce Europe
In the table above from Ecommerce Europe, Germany leads with a 2.22% conversion rate, while Italy trails at 0.99%. That's more than a 2x gap between two large EU economies.
Several factors drive these country-level differences:
• Payment method availability: Markets like Germany and the Netherlands favor direct debit and buy-now-pay-later options. Stores that only offer credit cards lose conversions in these regions
• Logistics maturity: Next-day delivery expectations vary. UK and Germany shoppers expect fast delivery, while markets with weaker logistics infrastructure tolerate longer waits
• Consumer trust: Return policies, consumer protection laws, and familiarity with online shopping all influence willingness to complete a purchase
• Purchasing power parity: The same product at the same price converts differently based on local income levels
According to Statista's US online shopper data, the US conversion rate peaked at 2.6% during Q2 2021, with more recent quarters settling around 2.3%. If you sell internationally, benchmark each market separately rather than using a single global target.
Average Ecommerce Conversion Rate by Traffic Source
Where your visitors come from predicts how likely they are to buy. Traffic source is one of the strongest conversion rate predictors because it reflects buyer intent. Someone clicking from a product review has very different purchase readiness than a casual social media scroller.
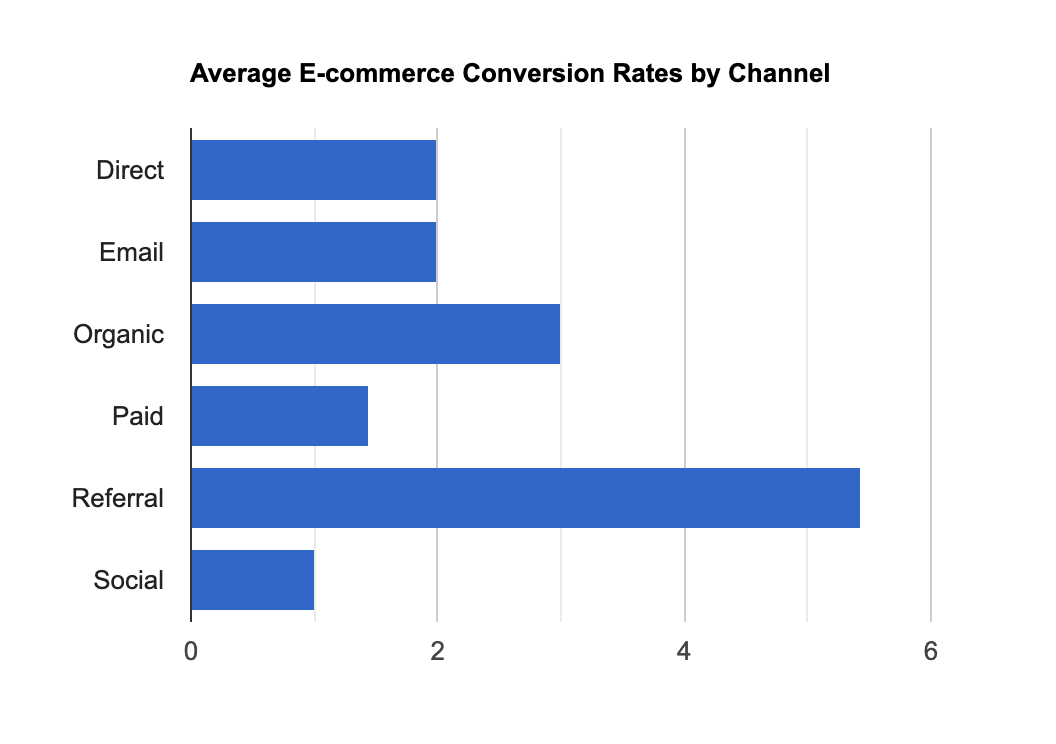
Conversion rates by traffic channel
According to Adobe's benchmark data, referral traffic leads at 5.44% conversion rate, followed by organic search at 3.0%, while social media lags at just 1.0%.
That 5x gap between referral and social traffic isn't surprising. Referral visitors arrive pre-qualified, often from a recommendation or review that already built trust. Social visitors are usually in discovery mode, not buying mode.
What to do: Don't judge all traffic equally in your analytics. Set channel-specific conversion goals. A 1% rate from Instagram might be excellent if those visitors have high average order values, while a 3% rate from paid search might be underperforming relative to the intent signals those keywords carry.
Organic search accounts for roughly 32% of total ecommerce traffic. That makes SEO-driven traffic the backbone of most stores' conversion volume, even if referral traffic converts at a higher rate per session. Your digital marketing strategy should balance volume channels (organic, social) with high-converting channels (referral, email).
According to Statista's research on user-generated content, stores using UGC technology saw a 3.2% baseline conversion rate in 2022, and users who actively interacted with UGC experienced a 102.4% increase in conversion. That's the kind of engagement-driven lift that bridges the gap between browsing and buying, regardless of traffic source.
Ecommerce Conversion Rate Trends for 2026
Source: LinkedIn industry report, 2026
Two forces are reshaping ecommerce conversion rates in 2026: AI-powered personalization and the continued shift to social commerce. Both change how shoppers discover, evaluate, and buy products online.
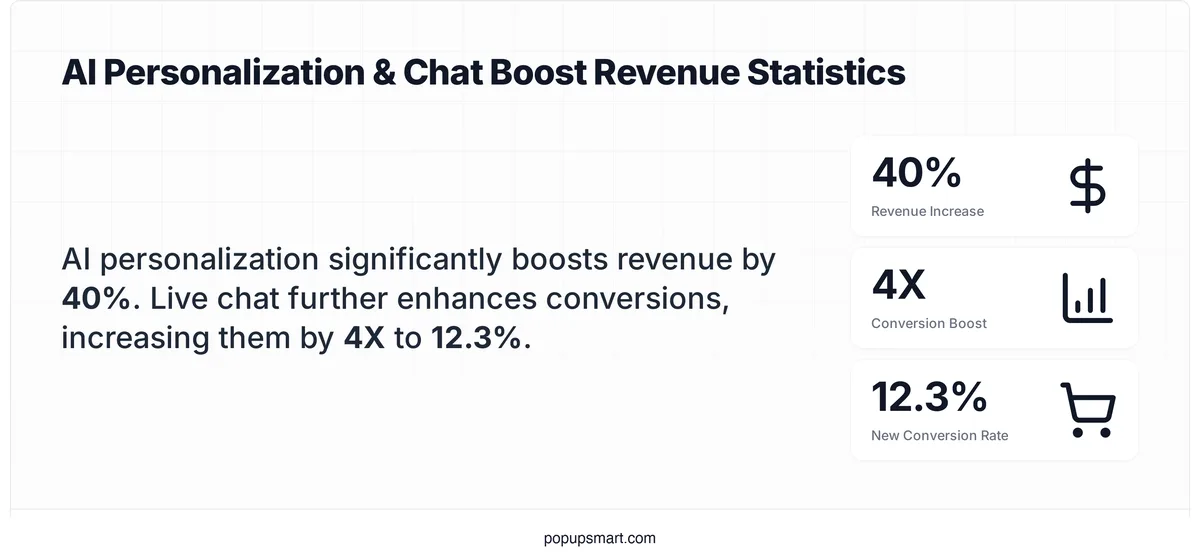
According to a LinkedIn industry report, AI personalization boosts ecommerce revenue by 40%, and live chat powered by AI pushes conversion rates 4x higher to 12.3%.
That 12.3% figure is remarkable. Most stores consider 3-4% world-class, so a 4x lift from chat-based selling represents a paradigm shift in how conversion optimization works. Instead of optimizing page elements, the chat interface handles objections, recommends products, and guides purchase decisions in real time.
If you haven't tested AI chat on your product pages, start with your highest-traffic, lowest-converting product category. Even a basic implementation that answers sizing questions or shipping timelines can move conversion rates meaningfully.
According to Wizart, around 97% of Gen Z shoppers use social media as their primary source of shopping inspiration. That figure explains why social commerce is projected to grow rapidly even though social traffic currently converts at low rates. The buying behavior is migrating to platforms like TikTok Shop and Instagram Checkout, where the entire purchase happens without leaving the app.
Global retail ecommerce sales are forecast to reach $6.88 trillion in 2026, up from $6.42 trillion in 2025. That growth comes despite flat or slightly declining average conversion rates, meaning stores are compensating with more traffic, higher AOV, and new channels. The stores winning aren't necessarily converting at higher rates. They're converting the right customers more efficiently.
How to Improve Your Ecommerce Conversion Rate
Source: GoKickflip, 2026
Knowing your benchmarks is step one. Actually improving your conversion rate requires systematic testing across your entire purchase funnel. Here's what the data says works.
Personalize the Product Experience
According to GoKickflip, companies using product personalization report an average conversion uplift of 150% compared to traditional static product flows.
A 150% uplift means a store converting at 2% could reach 5% by letting customers customize products (color options, engraving, sizing configurations) before adding to cart. Personalization reduces the gap between what the shopper imagines and what they're actually buying.
What to do: Start with your top 10 products by traffic. Add configuration options, size guides with body measurement inputs, or "complete the look" bundles. Even simple personalization (showing "Customers in [city] also bought...") creates the impression of a tailored experience.
Reduce Cart Abandonment
The average cart abandonment rate sits near 70%, meaning seven out of ten shoppers who add items to their cart leave without buying. The top reasons haven't changed much over the years: unexpected shipping costs, forced account creation, and slow delivery estimates.
You can recover a meaningful portion of those abandoned carts with exit-intent detection. When a shopper moves their cursor toward the browser's close button, a well-timed popup showing free shipping thresholds or a limited-time discount can bring them back. We've built Popupsmart specifically for this use case, giving ecommerce stores a no-code way to deploy exit-intent, scroll-triggered, and time-delayed popups that recover abandoned sessions.
Email follow-up sequences remain one of the highest-ROI recovery tactics. Sending a three-email sequence (1 hour, 24 hours, 72 hours post-abandonment) consistently outperforms single reminder emails. The first email should be a simple product reminder with no discount. Save the incentive for the third email, paired with a 48-hour expiry to create genuine urgency.
Optimize Your Checkout Process
Long, complicated checkouts kill conversions. The fix isn't always removing fields. Sometimes it's reorganizing them so shoppers feel progress.
Guest checkout is non-negotiable in 2026. Forcing account creation before purchase is the second-most-cited reason shoppers abandon carts. Offer account creation after the purchase confirmation, when the transaction is complete and the customer has a reason to save their details.
Tip: Audit your checkout in under 60 seconds. Count the total form fields. If you're asking for more than 8-10 fields (name, email, shipping address, payment), you're probably over-collecting. Cut unnecessary fields and add a progress indicator showing shoppers how close they are to completing the order.
Use High-Quality Product Images and Video

Product photography setup for ecommerce
Online shoppers can't touch, hold, or try on your products. Images and video are the only bridge between curiosity and confidence. Stores that invest in professional product photography and 360-degree views consistently outperform those relying on manufacturer-supplied images.
Video is particularly effective for products where motion, scale, or functionality matters: clothing (how it drapes), electronics (interface demos), furniture (how it fits in a room). Even short 15-second product clips reduce return rates while increasing conversion.
Deploy Time-Sensitive Offers Strategically

Coupon code entry on mobile checkout
According to SpendMeNot's coupon research, over 90% of all consumers have used coupons. Limited-time offers work because they compress the decision timeline. A 10% discount that expires in 24 hours converts better than a 15% discount with no expiry, because urgency drives action.
The key is delivery method. Popups and sticky bars outperform static banners because they interrupt the browsing flow at the right moment. Test different triggers: time-on-page (show after 30 seconds), scroll depth (show after 50% page scroll), or exit-intent for Shopify stores. And always verify your coupon codes actually work. Broken codes are a fast path to abandoned carts.
Ecommerce Conversion Rate by Year & Historical Trends
Ecommerce conversion rates have remained surprisingly stable over the past decade, oscillating between 1.5% and 3% despite dramatic improvements in website technology, payment options, and personalization tools.
| Year | Approximate Global Average | Notable Factor |
|---|---|---|
| 2020 | 2.1–2.5% | COVID-19 spike in online shopping |
| 2021 | 2.3–2.6% | Peak US rate at 2.6% (Q2) |
| 2022 | 2.0–2.5% | Post-pandemic normalization |
| 2023 | 1.9–2.3% | Mobile traffic share surpasses 70% |
| 2024 | 1.65–2.5% | AI personalization adoption begins |
| 2025 | 2.5–3.0% | AI chat and social commerce growth |
| 2026 (projected) | 2.5–3.0% | Personalization and omnichannel focus |
According to a Scayle industry debate on LinkedIn, ecommerce conversion rates have remained volatile between 1.5% and 2.5% for two decades despite significant investment in CRO. The consensus from that debate: conversion rates aren't stagnant because optimization doesn't work. They're stagnant because buyer expectations rise in parallel with store improvements, creating a constant moving target.
This flattening effect matters for your planning. Don't build your revenue forecast around a hypothetical 5% conversion rate unless you're in food and beverage or have compelling data to support it. Instead, focus on increasing traffic quality and average order value alongside conversion rate. Those three levers together produce sustainable ecommerce growth.
CRO Case Studies & What Actually Moves the Needle
Statistics show what's possible. Case studies show what's practical. Here are real results from stores that made specific changes and measured the outcome.
According to Blue Stout's case study collection, Envelopes.com achieved 40% more conversions by implementing abandoned cart follow-up sequences.
That's not a small A/B test variation. A 40% lift from a single tactic (email follow-ups) shows how much revenue most stores leave unrecovered. Envelopes.com sells a low-consideration product, so the follow-up simply reminded shoppers of what they already intended to buy.
What to do: Calculate your current cart recovery rate. If you're not sending automated follow-up emails, you're likely recovering less than 5% of abandoned carts. Even a basic 3-email sequence recovers 8-12% of abandoned orders for most stores.
Edible Arrangements boosted same-day sales by 8% with a single messaging change, also documented by Blue Stout. The change? Adding a clear "order by [time] for same-day delivery" message to product pages. That's a zero-cost optimization that took hours to implement and immediately moved revenue.
According to CRO Benchmark, product page optimization efforts led to a 30% increase in conversion rates in one documented case. The changes included better product photography, more detailed size guides, and visible trust signals (return policy, shipping information) above the fold.
These case studies share a pattern: the highest-ROI optimizations don't require complete site redesigns. They require identifying the specific point where shoppers hesitate and removing that friction. For most stores, that point is either the product page (insufficient information) or checkout (too much friction). Tools like Popupsmart's conversion-focused popups help address both by surfacing the right information at the right moment.
What Is a Good Ecommerce Conversion Rate?
"Good" depends entirely on context. A 1.5% conversion rate in luxury jewelry is strong. The same rate in pet supplies suggests problems. Here's a framework for evaluating your own rate:
| Performance Level | Conversion Rate | What It Means |
|---|---|---|
| Below average | Under 1% | Significant friction or targeting issues |
| Average | 1–2.5% | Room for optimization in most industries |
| Good | 2.5–3.5% | Performing at or above benchmarks |
| Excellent | 3.5–5% | Well-optimized store with strong funnel |
| Top performer | 5%+ | Elite stores, often niche or high-intent traffic |
According to WordStream, a good conversion rate for ecommerce is 4.8%. That's higher than most benchmark reports suggest, partly because WordStream's data includes landing page conversions (which typically outperform full-site averages) and factors in paid traffic with stronger purchase intent.
The real question isn't "is my rate good?" but "is my rate improving?" A store converting at 1.8% that improved from 1.2% over six months is in a much healthier position than one that's been stuck at 3% for two years. Continuous optimization matters more than hitting a specific number.
As Fyresite points out, a store can be "below average" on conversion rate and still be highly profitable if margins are strong. Always prioritize contribution margin over raw CVR. A 1% conversion rate on a $500 AOV product with 60% margins generates more profit per session than a 4% rate on a $20 product with 15% margins.
How We Gathered Ecommerce Conversion Rate Stats
We pulled conversion rate data from 16 different sources for this article, cross-referencing benchmark reports from Dynamic Yield, Adobe, Red Stag Fulfillment, Statista, and Speed Commerce against industry-specific data from Fyresite, Store Growers, and GoKickflip. The challenge with ecommerce conversion rate data is that every source defines "conversion" slightly differently (some count add-to-cart, others only completed purchases) and measures different store samples.
Where possible, we prioritized sources that disclose their methodology and sample size. Dynamic Yield's benchmark, for instance, pulls from thousands of live ecommerce sites with real-time updates, making it more reliable than annual surveys with small sample sizes. Adobe's data comes from their Analytics platform across major enterprise retailers, which skews toward larger stores. Smaller store benchmarks from Blend Commerce and Nector reflect the Shopify and mid-market segments better.
Your Next Step For Ecommerce Conversions
Ecommerce conversion rates have barely budged industry-wide over two decades, hovering between 1.5% and 3%. Yet individual stores regularly break past 5% through systematic optimization. The gap between the industry average and top performers is where your opportunity lives.
If your store converts below your industry benchmark, start with the three highest-impact fixes: streamline checkout (guest checkout, fewer form fields), recover abandoned carts (3-email sequence), and personalize the product experience (recommendations, configuration options). Those three changes alone account for the majority of conversion rate gains in documented case studies.
For stores already at or above benchmark, the next frontier is AI-powered personalization and real-time engagement. The 150% uplift from product personalization and the 4x conversion boost from AI chat aren't theoretical. They're being reported by stores implementing these tools right now.
Frequently Asked Questions
What Is a Good Ecommerce Conversion Rate?
A good ecommerce conversion rate generally falls between 2.5% and 3.2%, according to Network Solutions. Top-performing stores exceed 5%, but "good" depends on your industry, traffic mix, and product price point. Food and beverage stores might target 5%+, while luxury retailers might consider 1.5% strong. Measure against your specific vertical's benchmarks rather than a universal standard.
How Do You Calculate Ecommerce Conversion Rate?
Divide the number of completed purchases by total website sessions, then multiply by 100. The formula: (Transactions / Sessions) x 100 = Conversion Rate. If your store had 8,000 sessions and 200 purchases last month, your conversion rate is 2.5%. Google Analytics automates this calculation in the Ecommerce section. Make sure you're using sessions (not unique users) as the denominator for consistency with industry benchmarks.
Is a 1.3% Conversion Rate Good?
A 1.3% conversion rate falls below the global average of 2-3%, so there's room for improvement for most industries. However, for high-ticket categories like furniture (0.8-1.5% average) or luxury goods (0.9% average), 1.3% is right in the expected range. Before worrying about the number, check it against your industry benchmark. If you're in apparel or electronics and sitting at 1.3%, focus on checkout optimization and product page improvements as your first optimization priorities.
What Is the Average Ecommerce Conversion Rate by Industry?
Industry averages vary by more than 5x. Food and beverage leads at approximately 6.11%, followed by health and beauty at 3.3%, fashion at 2.7%, entertainment at 2.5%, household goods at 2.1%, and electronics at 1.9%. Furniture and luxury goods convert at under 1.5%. These figures come from Adobe, Dynamic Yield, and Red Stag Fulfillment benchmark reports covering 2024-2025 data. Always check the recency and sample composition of any benchmark you reference.
Which Traffic Sources Offer Higher Conversion Rates for Ecommerce?
Referral traffic converts highest at 5.44%, followed by organic search at 3.0%, direct traffic at 2.2%, and paid search at 1.8%. Social media trails at 1.0%, according to Adobe's benchmark data. However, volume matters as much as rate. Organic search delivers roughly 32% of total ecommerce traffic. The best strategy combines high-volume channels (organic, paid) with high-converting channels (referral, email) and uses website conversion rate benchmarks to set channel-specific goals.

How would you rate your experience with this article? 😊