Digital Marketing Statistics 2026: Trends & Insights
Guide to 2025 digital marketing stats and KPIs across SEO, social/paid, email and on-site CRO, with IT services benchmarks and AI-driven trends. Emphasizes data-led optimization, personalization, testing, and interactive popups to boost ROI.
Digital marketing statistics for 2026 show global ad spend reaching $653.65 billion, with the market projected to hit $1.5 trillion by 2030. Organic search drives 53% of all website traffic, email marketing returns $36 for every $1 spent, and over 70% of consumers expect personalized brand interactions. Below are 50+ statistics with sources covering every major channel.
Why Do Digital Marketing Statistics Matter for Performance-Driven Teams?
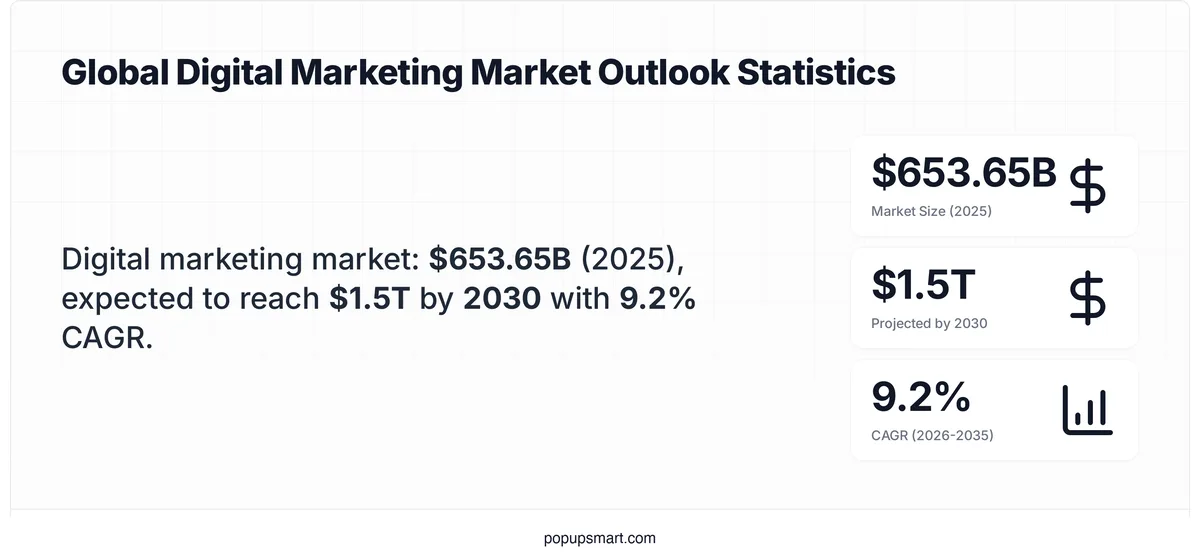
• The global digital marketing market was valued at $653.65 billion in 2025 and is on track to reach $1.5 trillion by 2030 — Expert Market Research
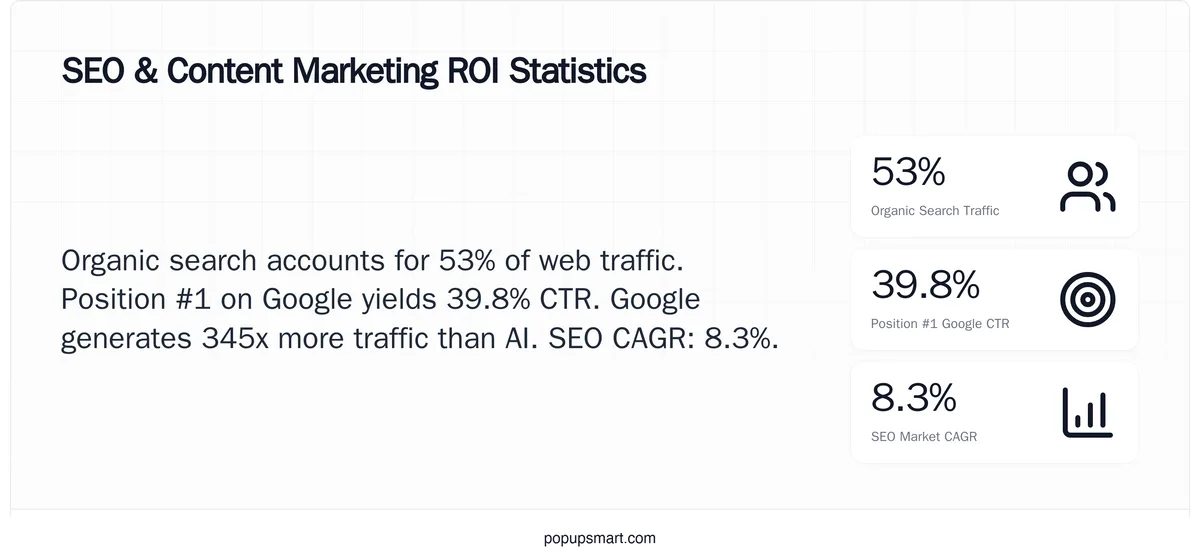
• Organic search drives 53% of all trackable website traffic, while social media accounts for just 5% — BrightEdge
• Google still sends 345x more traffic to websites than AI chatbots and answer engines — Ahrefs
• Emails with personalized subject lines are 50% more likely to be opened than generic ones — Zoogly (citing InfoGroup data)
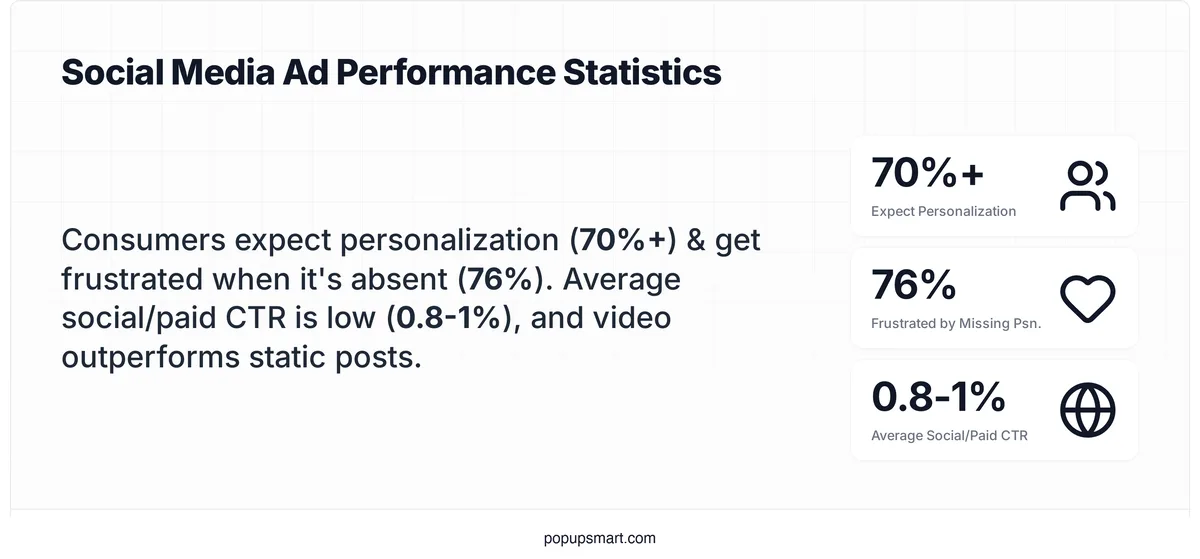
• Over 70% of consumers expect personalized interactions from brands, and 76% get frustrated when that doesn't happen — McKinsey & Company
• The global SEO market is growing at a CAGR of 8.3% from 2024 to 2030 — WordStream (citing Research and Markets)
Digital marketing statistics give marketing teams a concrete basis for budget decisions, channel prioritization, and campaign optimization. Without benchmarks, you're allocating spend based on gut feeling rather than evidence.
I've spent years helping brands optimize their on-site conversion flows, and one pattern keeps repeating: the teams that track channel-level data consistently outperform those that rely on surface-level metrics. Numbers like cost per qualified lead, organic traffic share, and email click-through rates expose problems long before quarterly revenue reports reveal them.
These aren't just dashboard decorations. When a marketing director sees that organic search drives 53% of trackable traffic while social media contributes only 5%, that changes how the next quarter's budget gets split.
Tip: Build a monthly review cadence around 5-7 KPIs tied directly to revenue: organic traffic growth, conversion rate by channel, CAC, email engagement, and on-site interaction rates. Track against industry benchmarks from this guide to spot underperformance early.
What Is the Global Digital Marketing Market Size in 2026?
The global digital marketing industry has grown from a $671.6 billion market in 2023 to an estimated $653.65 billion in marketing software and services by 2025, with projections pointing toward $1.5 trillion in total digital advertising and marketing spend by 2030. Multiple research firms confirm double-digit compound annual growth rates across every major segment.
Global digital marketing market size and growth projections
The global digital advertising and marketing market will reach $1.5 trillion by 2030, up from $671.6 billion in 2023. — Semrush (citing Research and Markets, 2024)
That's more than a doubling in seven years. For marketing teams at mid-sized companies, this growth means more competition for attention across every channel. Rising ad costs and audience fragmentation make data-driven targeting more valuable than raw budget increases.
What to do: Audit your current channel mix against growth projections. If you're over-indexed on channels with rising CPMs (paid social, display), shift 10-15% of budget toward compounding channels like SEO and email that deliver returns over time.
According to Expert Market Research, the digital marketing market is expected to grow at a CAGR of 9.20% from 2026 to 2035, reaching $1,576.06 billion.
Different research firms size the market differently depending on what they include (software only vs. total ad spend), but the directional signal is consistent. Fortune Business Insights projects the digital marketing software segment alone will grow from $106.39 billion in 2026 to $404.01 billion by 2034 at an 18.15% CAGR. IMARC Group pegs the broader market at $456.7 billion in 2025, targeting $1,200.3 billion by 2034.
The variation in estimates matters less than the consensus: every credible source forecasts sustained double-digit growth. For businesses still treating digital as a secondary channel, these numbers make the cost of inaction clear.
If your organization hasn't formalized a digital-first marketing strategy, start with a channel audit. Identify which of your current channels align with the fastest-growing segments (video, AI-driven personalization, programmatic) and reallocate resources accordingly. Our guide on benefits of digital marketing for small businesses breaks down where to start.
What Are the Most Important SEO and Content Marketing Statistics for 2026?
SEO remains the single largest source of trackable website traffic, and the gap between well-optimized content and everything else keeps widening. In 2026, the data confirms that organic search still dominates acquisition, but AI-generated search results are creating new dynamics marketers need to account for.
SEO and content marketing performance benchmarks for 2026
Organic search drives 53% of all trackable website traffic, while social media accounts for just 5%. — BrightEdge
This stat has been remarkably stable for years, and it underscores a basic allocation problem most teams face: social media gets disproportionate attention relative to the traffic it actually delivers. The 10:1 ratio between organic search and social referral traffic means every dollar invested in SEO typically compounds faster than equivalent social spend.
What to do: Calculate your current traffic split by channel in Google Analytics 4. If organic search is below 40% of your total, audit your content strategy for keyword gaps, thin pages, and internal linking weaknesses. Our Webflow statistics guide covers how site architecture affects organic performance.
Position #1 on Google earns an average click-through rate of 39.8%, with steep drop-offs for lower positions. — InnerSpark Creative (Digital Marketing Benchmarks)
The CTR difference between position 1 and position 3 is often 3-4x. This makes ranking improvements from position 5 to position 1 far more valuable than ranking for additional low-volume keywords. Focused optimization on existing near-top content typically delivers faster ROI than creating new pages from scratch.
Tip: Run a Search Console query report filtered to positions 4-10 with impressions above 500/month. These are your highest-ROI optimization targets. Refresh content, improve internal linking, and update title tags to climb into CTR-rich territory.
Google still drives 345x more traffic to websites than AI chatbots and answer engines. — Ahrefs AI SEO Statistics Report (2025)
Despite the hype around AI search replacing Google, the actual traffic data tells a different story. AI-powered search tools generate a fraction of the referral volume that traditional search provides. That said, the Ahrefs report also notes that pages appearing inside Google's AI Overviews can experience up to a 34.5% drop in CTR, particularly on informational queries.
What to do: Don't abandon your SEO strategy in favor of AI optimization. Instead, add GEO (Generative Engine Optimization) techniques alongside existing SEO: structured answer capsules, specific statistics with source citations, and question-based headings that AI engines prefer to cite. Check out our ChatGPT prompts for SEO for practical implementation ideas.
The global SEO market is anticipated to grow at a CAGR of 8.3% from 2024 to 2030. — WordStream (citing Research and Markets)
This growth rate confirms that businesses are increasing their SEO investments, not pulling back. The market expansion is driven by AI-assisted content creation, technical SEO complexity, and the growing importance of local and mobile search optimization.
If your SEO investment has been flat year-over-year, you're falling behind competitors who are scaling. Evaluate whether your team has the technical SEO capabilities (Core Web Vitals optimization, structured data, crawl management) needed to compete in 2026.
.png)
What Do Social Media and Paid Advertising Benchmarks Show in 2026?
Social media and paid advertising remain essential components of most marketing stacks, but the data shows that returns depend heavily on targeting precision and format selection. Broad-targeting campaigns are losing ground to segmented, personalized approaches, and short-form video continues to outperform static content across platforms.
Social media and paid advertising performance benchmarks for 2026
Over 70% of consumers expect personalized interactions from companies, and 76% become frustrated when those expectations aren't met. — McKinsey & Company
Personalization isn't a nice-to-have anymore. Three out of four consumers actively penalize brands that serve generic experiences. In paid social, this means dynamic creative optimization and audience segmentation aren't optional upgrades, they're baseline requirements for competitive ad performance.
Tip: Implement dynamic ad creative that adjusts messaging based on audience segment. Start with your three highest-spend campaigns and test personalized vs. generic versions. Even basic personalization (industry-specific headlines, role-based value propositions) typically lifts CTR by 15-25%.
Many industries maintain average click-through rates of 0.8-1% on broad-targeting social and paid campaigns. — SalesHive (Digital Marketing Benchmarks)
If your social ad CTR sits below 0.8%, you're underperforming the industry average, and your cost per acquisition is likely inflated. Short-form video ads consistently beat this benchmark by 2-3x on platforms like TikTok and Instagram Reels, according to reporting from NewMedia.
What to do: Shift 20-30% of your static ad budget into short-form video testing. Produce 5-10 creative variants per campaign and let the platform's algorithm identify winners. Track CTR alongside cost-per-conversion, not just impressions. For e-commerce brands, our Shopify statistics guide covers platform-specific conversion data.
58% of users say they don't click on ads because they aren't relevant, and 57% cite security and privacy concerns. — Zoogly
More than half of users actively avoid ads due to relevance and trust issues. This data should inform both creative strategy and landing page design. Ads that match user intent and land on pages that deliver on the ad's promise see dramatically higher conversion rates.
What to do: Audit your ad-to-landing-page alignment. Does the landing page headline match the ad copy? Does the offer appear above the fold? Run a social proof test on your landing pages: adding customer logos, review counts, or usage statistics near the CTA typically reduces the trust gap that drives those privacy concerns.
What Are the Key Email Marketing Statistics and Benchmarks?
Email continues to deliver the highest measurable ROI of any digital marketing channel. The benchmarks below confirm that personalization, segmentation, and behavioral triggers are the levers that separate average performers from top-tier email programs.
Email marketing performance benchmarks for 2026
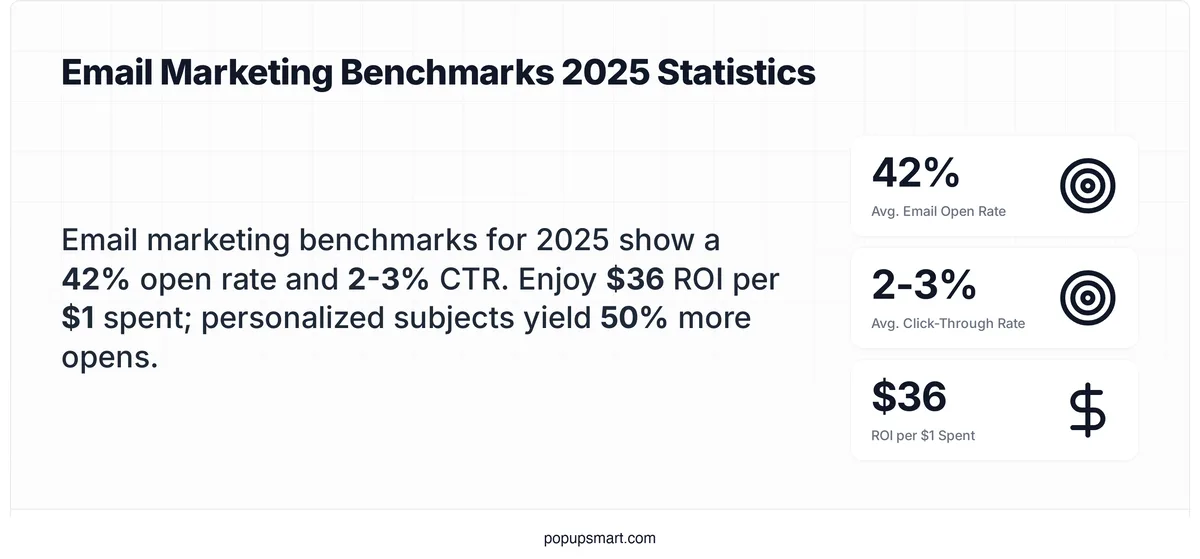
Email marketing generates an average return of $36 for every $1 spent. — Popupsmart Email Marketing Statistics
That 3,600% ROI figure makes email the most efficient acquisition and retention channel available. The return is driven primarily by low distribution costs (near-zero marginal cost per send) and the ability to reach already-engaged audiences. B2B companies that combine email with on-site conversion tools see even higher returns because they're nurturing leads who've already shown intent.
If your email program isn't generating at least $20 per $1 spent, audit your list quality and segmentation strategy. Remove inactive subscribers (no opens in 90+ days), segment by behavior (product page visits, cart additions), and build automated sequences triggered by on-site actions.
Emails with personalized subject lines are 50% more likely to be opened. — Zoogly (citing InfoGroup research)
A 50% open rate lift from personalization alone makes subject line optimization one of the highest-impact email tactics. Personalization goes beyond inserting a first name. Industry-specific references, behavior-triggered content, and timing based on engagement patterns all contribute to the lift.
Tip: Test three personalization approaches in your next campaign: name-based, behavior-based ("You viewed [product]"), and segment-based ("For [industry] teams"). Measure open rates and click-through rates separately for each. Most teams find behavior-based personalization outperforms name insertion by 20-30%.
Global email campaigns average around 42% open rates in reported datasets, though these numbers are inflated by Apple Mail Privacy Protection. — DollarPocket (Email Benchmarks)
Apple's Mail Privacy Protection, rolled out in iOS 15, pre-loads tracking pixels for all Apple Mail users. This artificially inflates open rates by 15-25% depending on your audience's device mix. Click-through rate (averaging 2-3% across industries, per MailerLite) is now a more reliable engagement signal than open rate for most B2B email programs.
What to do: Shift your primary email KPI from open rate to click-through rate and reply rate. These metrics aren't affected by privacy proxy loading.
.png)
How Is AI Changing Digital Marketing Performance in 2026?
AI adoption in marketing has moved from experimental to operational. In 2026, marketing teams aren't asking whether to use AI, they're figuring out which applications deliver measurable returns. The statistics below separate hype from evidence.
In 2024, the top marketing channels driving ROI for B2B brands were (1) website/blog/SEO, (2) paid social media content, and (3) social media shopping tools. — HubSpot State of Marketing Report (2025)
SEO and content remain the top ROI channel even as AI tools proliferate. AI is accelerating content production and optimization, but the underlying channel economics haven't changed. Websites and blogs still convert at higher rates than social-only strategies because they capture intent-driven traffic.
What to do: Use AI tools to scale your existing top-performing channel (SEO/content) rather than chasing new AI-native channels with unproven ROI. AI-assisted keyword research, content briefs, and on-page optimization deliver faster returns than AI-generated content published without editorial oversight.
AI-driven personalization can improve click-through rates by 20-30%. — McKinsey
The CTR improvements from AI personalization compound across the funnel. A 25% CTR lift on email, combined with a 20% improvement on landing page personalization, can double your end-to-end conversion rate. The challenge is data quality: AI personalization engines need clean behavioral data, accurate segmentation, and enough volume to learn from.
What to do: Start with one high-volume touchpoint (email subject lines or homepage hero content) and implement basic AI personalization. Track the CTR delta against your control for 30 days before expanding. At Popupsmart, we've seen brands achieve similar lifts by using behavior-based popup targeting, which shows visitors different messages based on their browsing patterns and referral source.
AI-enhanced lead scoring can increase accuracy by 40-50%. — Salesforce
Improved lead scoring accuracy means sales teams spend less time on unqualified prospects. For B2B companies with average deal cycles of 3-6 months, a 40% improvement in scoring accuracy can reduce sales cycle length by weeks. The impact is especially visible in IT services and SaaS, where lead generation statistics show that 61% of marketers rank generating quality leads as their biggest challenge.
If you're still scoring leads based on demographic data alone, add behavioral signals (page visits, content downloads, email engagement) to your scoring model. Most CRM platforms now offer AI-assisted scoring as a standard feature.
AI-based chat and automation can reduce customer response times by up to 60%. — McKinsey
Response time directly correlates with conversion probability. In B2B, leads contacted within 5 minutes are 21x more likely to qualify than those contacted after 30 minutes. AI chatbots close that gap by providing instant, contextual responses 24/7. For SaaS companies, the operational benefit is compounded: your sales team handles pre-qualified conversations instead of cold inquiries.
According to our chatbot statistics report, over 58% of B2B companies already use chatbots on their websites, with business leaders reporting a 67% increase in sales through bot interactions.
What to do: Deploy a chatbot on your highest-traffic pages (pricing, features, homepage) with conversation flows designed to qualify intent and route leads to sales. Track the percentage of chat conversations that convert to demos or signups, and compare against your form-only conversion rate.
Predictive analytics can lower bounce rates by identifying early-exit patterns before they compound. — McKinsey
Most marketing teams spot bounce rate problems after they've already affected performance metrics. Predictive analytics tools flag patterns (specific traffic sources, device types, or landing page variants producing above-average exits) early enough to intervene. When paired with on-site personalization, predictive models can trigger different content or offers for visitor segments showing early-exit signals.
Tip: Set up real-time alerts for bounce rate spikes on your top 10 landing pages. When a page's bounce rate increases by more than 10% week-over-week, investigate immediately. Common causes include slow load times, mobile rendering issues, or ad-to-page message mismatch.
What Conversion Rate and ROI Benchmarks Should Marketers Track?
Conversion rate data helps marketing teams identify where their funnel underperforms relative to industry averages. The benchmarks below provide specific targets for B2B and B2C companies across different conversion points.
Average B2B conversion rates sit around 2.2% globally, while B2C averages approximately 1.8%. — HubSpot (2024)
The B2B premium over B2C reflects the difference in traffic quality: B2B visitors are typically further along in their buying journey when they reach a website. But 2.2% means nearly 98 out of 100 visitors leave without converting. That gap represents significant recoverable revenue for teams willing to optimize their on-site experience.
What to do: Benchmark your current conversion rate against these numbers. If you're below 2% in B2B, prioritize above-the-fold clarity, form length reduction, and behavioral targeting. Exit-intent popups alone can recover 3-5% of abandoning visitors when the offer matches their browsing context.
B2B landing pages convert between 6-10% on average, depending on offer type. — WordStream (2024)
The spread between 6% and 10% is driven almost entirely by offer relevance. Landing pages offering free trials and calculators convert at the high end; pages pushing demo requests without context convert at the low end. Page speed matters too: according to our landing page statistics report, a 1-second delay in load time causes a 7% reduction in conversions.
Tip: Test your highest-traffic landing page with three offer variants: a free tool, a content download, and a demo request. Measure conversion rate and lead quality for each over 2-4 weeks. Most B2B teams find that value-first offers (tools, templates, audits) convert 2-3x higher than demo-gated pages.
Companies running structured A/B tests see up to 20% higher conversion lifts across their funnels. — VWO
The operative word is "structured." Random testing without hypotheses or adequate sample sizes produces noise, not signal. Teams that run systematic test programs (hypothesis, test, measure, implement) compound small wins into significant long-term improvements.
What to do: Commit to running one properly structured A/B test per month on your highest-traffic conversion point. Use a sample size calculator to ensure statistical significance, and document every result (wins and losses) to build institutional knowledge.
More than one-third of marketing leaders rank conversion rate as their top KPI. — Salesforce
Conversion rate earns this priority because it's the metric that connects marketing activity to revenue most directly. Traffic growth means nothing if conversion rates are declining. A site getting 100,000 monthly visits at a 1% conversion rate generates the same revenue as one getting 50,000 visits at 2%. The second scenario costs less to acquire and maintain.
Tip: Set up conversion rate dashboards segmented by traffic source, device type, and landing page. Compare your rates against the benchmarks in this guide. If any segment falls below the industry average, investigate whether the issue is traffic quality (wrong audience), page experience (slow load, poor mobile rendering), or offer mismatch (CTA doesn't match the visitor's stage). Tools like Popupsmart's CRO checker can identify specific friction points in your conversion flow.
What Digital Marketing Trends and Predictions Are Shaping 2026?
Forward-looking data helps marketing teams prepare for shifts before they become competitive disadvantages. The predictions below are grounded in current trajectory data and analyst projections rather than speculation.
AI-driven marketing investments are projected to grow by over 25% year-over-year through 2026. — Gartner
The investment growth reflects real performance gains, not just hype. Early adopters of AI-powered campaign optimization, content personalization, and predictive analytics are reporting measurable improvements in cost efficiency and conversion rates. The gap between AI-adopting teams and laggards is widening each quarter.
What to do: Identify your single biggest manual bottleneck in marketing operations (reporting, content production, lead routing) and evaluate an AI solution for that specific workflow. Start narrow, measure ROI after 90 days, then expand.
Over 80% of Americans go online every day, and 32% describe themselves as online "almost constantly." — Pew Research
Near-constant connectivity means your audience is reachable across multiple touchpoints throughout the day. But it also means attention is fragmented. The brands winning aren't those that show up everywhere, they're the ones that show up at the right moment with the right message. At Popupsmart, we've seen this play out directly: behavior-triggered popups timed to scroll depth and exit intent consistently outperform time-based triggers by 2-3x.
Pro tip: Map your customer's daily digital touchpoints and identify 2-3 moments where your product solves an active problem. Build messaging around those moments rather than trying to maintain constant presence across every channel.
Gamification and Interactive Content Trends
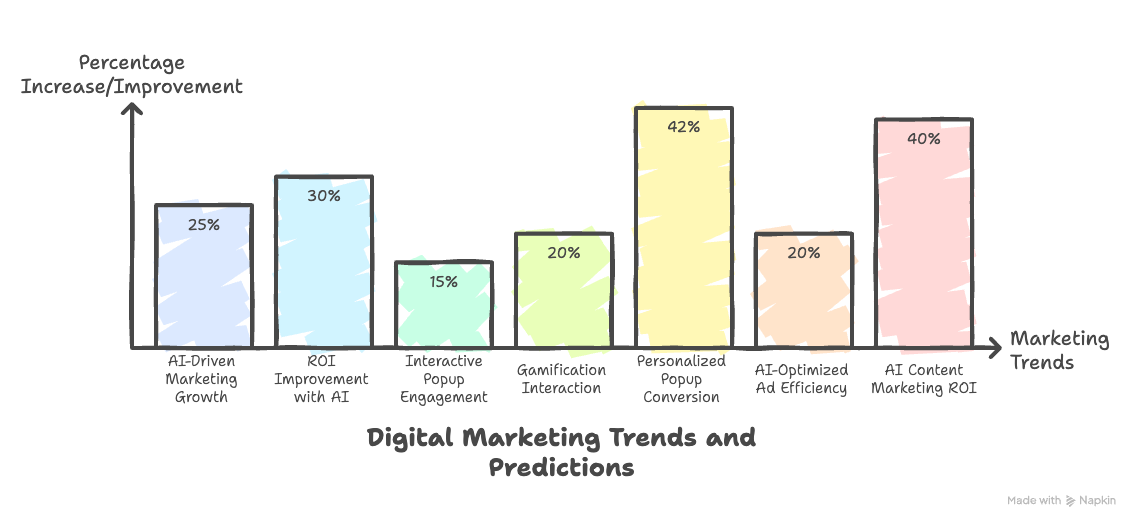
According to Popupsmart's 2025 benchmark data, campaigns using targeted popups report an average interaction rate of 50.9% and a conversion rate around 31.6% across more than 10,000 campaigns. Gamified formats (spin-to-win wheels, scratch cards, quiz-based popups) push those numbers even higher.
Interactive content formats are expected to drive 20% more on-site engagement by 2026, especially in B2B contexts where quizzes, ROI calculators, and assessment tools qualify leads while providing immediate value.
What to do: Test one gamified or interactive element on your highest-traffic page. Even a simple quiz ("Which plan is right for you?") can increase engagement time and capture lead data that static forms miss.
Privacy, Ethics, and Trust in Marketing
Brands emphasizing inclusivity in their marketing see up to 22% higher engagement across digital channels, according to HubSpot. Trust and transparency matter more as third-party cookies phase out and privacy regulations tighten globally.
Retention gains of 18% are forecasted for brands maintaining transparent data practices. For video marketing and social content especially, authentic messaging resonates stronger than polished but generic creative.
What to do: Audit your data collection practices. Make sure your opt-in forms, cookie consents, and email subscription processes clearly communicate what data you collect and why. Transparency builds the trust that drives long-term customer value.
Regional Growth Patterns in Digital Marketing
Digital marketing adoption and performance differ significantly by region. Understanding these differences matters for any team running campaigns across multiple geographies.
Global IT digital advertising spend is expected to surpass $150 billion in 2025, with Asia-Pacific leading at approximately 25% year-over-year growth. — DataReportal
Asia-Pacific shows the highest mobile-driven engagement rates among any region. Europe's growth is shaped by GDPR and privacy-first analytics requirements, which influence how brands target and retarget audiences.
North America leads in AI tool adoption for marketing automation, with 70% of B2B buyers reporting reliance on expert-led content during their purchasing process, according to the Content Marketing Institute.
Regional differences extend to content format preferences too. India and Southeast Asia show higher interaction rates for educational video content, while European audiences respond better to localized multilingual campaigns. Latin America is one of the fastest-growing regions for SEO investment, with double-digit annual increases in organic marketing budgets according to DataReportal.
Tip: If you run campaigns across multiple regions, segment your performance data by geography. What works in North America (long-form thought leadership, English-language webinars) may underperform in Asia-Pacific where mobile-first, short-form video content drives stronger engagement.
Adapt your content format and channel mix to match regional behavior patterns rather than applying a single global template.
How Should Marketers Apply These Digital Marketing Statistics to Their Strategy?
Statistics become useful only when they connect to specific actions. The data in this guide points to several clear priorities for marketing teams in 2026.
On-Site Conversion Optimization
Well-targeted popups convert up to 11.5%, while untargeted ones rarely exceed 3-4%. The difference is behavioral targeting: showing the right message to the right visitor at the right time.
Practical steps that work based on what I've seen across hundreds of Popupsmart popup campaigns:
• Use intent-based triggers: Exit-intent popups reduce abandonment and capture visitors who would otherwise leave without converting.
• Segment by behavior: Return visitors, pricing-page viewers, and high-scroll-depth readers respond to different offers. A first-time visitor needs education; a return visitor needs a reason to act now.
• Cap display frequency: Research consistently shows 1-2 popup views per session performs best. More than that increases bounce rates.
• Test relentlessly: Headline variations, CTA copy, timing delays, and offer types all impact conversion. Run one test at a time for clean results.
Channel Allocation Based on Data
The statistics in this guide paint a clear picture of channel efficiency:
| Channel | Key Metric | 2026 Benchmark |
|---|---|---|
| Organic Search (SEO) | Share of total traffic | 53% |
| Email Marketing | ROI per $1 spent | $36 |
| Social Media (organic) | Share of site traffic | 5% |
| Paid Social Ads | Average CTR | 0.8–1% |
| B2B Landing Pages | Average conversion rate | 6–10% |
| Personalized Popups | Average conversion rate | Up to 11.5% |
What to do: Use this table as a starting point for your quarterly budget review. Channels with compounding returns (SEO, email) deserve a larger share of long-term investment. Channels with immediate returns but no compounding (paid ads) work best for short-term campaigns and testing. For an in-depth look at how digital marketing drives sales, check our full strategy guide.
Measurement Framework
The most successful marketing teams track five to seven KPIs tied directly to revenue. Based on the data in this guide, here's what to prioritize:
1. Organic traffic growth rate (month-over-month, excluding brand queries)
2. Conversion rate by channel (separate SEO, email, paid, social, direct)
3. Customer acquisition cost (blended and by channel)
4. Email click-through rate (not open rate, because of Apple MPP inflation)
5. On-site engagement rate (popup interactions, scroll depth, time on page)
6. Lead quality score (MQL-to-SQL conversion rate)
Review these weekly in aggregate and run deeper monthly audits to catch underperformance before it compounds. Teams that use chatbot-assisted lead qualification alongside these metrics often see a 15-20% improvement in lead-to-opportunity conversion.
Sources and Methodology of Digital Marketing Statistics
This article aggregates data from 40+ sources across market research firms, SaaS industry reports, and original platform data. The market sizing figures draw from Expert Market Research, Fortune Business Insights, IMARC Group, Research and Markets, and Grand View Research, each of which scopes the "digital marketing market" differently (total ad spend vs. software-only vs. services). We've presented multiple estimates to give readers a transparent view of the range rather than cherry-picking a single number.
Channel-level benchmarks come from primary research: BrightEdge's channel share analysis (organic traffic data), Ahrefs' AI SEO report (Google vs. AI chatbot traffic), McKinsey's personalization study, and HubSpot's annual State of Marketing survey. Email benchmarks combine data from DollarPocket, MailerLite, and Zoogly (which cites InfoGroup's original personalization research). All conversion rate benchmarks reference HubSpot, WordStream, and VWO studies from 2024-2025.
We prioritized primary sources over secondary reporting. When a stat was originally published by one organization but widely cited by aggregators, we traced back to the original publisher. Statistics older than 2024 are noted with their original publication year. Popupsmart's own benchmark data (50.9% interaction rate, 31.6% conversion rate) comes from aggregated campaign performance across 10,000+ campaigns on the Popupsmart platform.
Frequently Asked Questions About Digital Marketing Statistics
What is the success rate of digital marketing?
Success rates vary by channel and definition. Average B2B conversion rates sit around 2.2% (HubSpot, 2024), while email marketing delivers $36 per $1 spent. SEO-driven organic traffic accounts for 53% of all trackable visits. The "success rate" of any digital marketing effort depends on your specific goals, audience, and execution quality. That said, the data consistently shows that companies combining SEO, email, and on-site conversion optimization achieve the strongest compound returns over time. Teams that run structured testing programs see up to 20% higher conversion lifts compared to those relying on intuition alone.
What are the latest digital marketing trends for 2026?
The dominant trends include AI-powered personalization (20-30% CTR improvement per McKinsey), the growing importance of GEO alongside traditional SEO (Google sends 345x more traffic than AI chatbots but AI Overviews are reducing CTR on informational queries), interactive content formats (gamified popups converting at 10%+), and a continued shift toward privacy-first analytics as third-party cookies phase out.
How has digital marketing grown worldwide?
The global digital marketing market was valued at $653.65 billion in 2025, according to Expert Market Research. Multiple forecasters project the market will reach between $1.2 trillion and $1.5 trillion by 2030-2034, growing at CAGRs ranging from 9% to 18% depending on market segment. Asia-Pacific leads regional growth at approximately 25% year-over-year.
What are important SEO statistics in digital marketing?
The most actionable SEO statistics: organic search drives 53% of website traffic (BrightEdge), position #1 earns 39.8% CTR (InnerSpark Creative), Google sends 345x more traffic than AI search tools (Ahrefs), and the global SEO market is growing at 8.3% CAGR (Research and Markets). AI Overviews can reduce CTR by up to 34.5% on informational queries, making featured snippet optimization increasingly important.
What benchmarks should I track for digital advertising?
Key benchmarks include social ad CTR (0.8-1% average for broad targeting), B2B landing page conversion rates (6-10%), email click-through rates (2-3% across industries), and personalization impact (70%+ consumers expect it). Track these alongside your customer acquisition cost and compare quarter-over-quarter to identify both improvements and emerging problems.
How do user behavior stats impact marketing strategies?
User behavior data directly shapes campaign decisions at every level. When 58% of users say they skip ads because they aren't relevant, that's a signal to invest in better targeting and creative personalization rather than higher ad spend. When 76% of consumers express frustration with generic brand experiences, that validates investment in behavioral triggers, dynamic content, and segmented messaging. Over 80% of Americans go online daily, and 32% are online "almost constantly" (Pew Research), meaning your audience is reachable but attention-fatigued. Behavior stats turn subjective strategy debates into evidence-based priorities, helping you allocate budget where the data says it will generate the highest return.
Related reading you might find useful:
• Top 13 Benefits of Digital Marketing for Small Businesses
• 16 Essential Lead Generation Statistics for 2026

How would you rate your experience with this article? 😊