50+ Email Marketing Statistics: Key Insights and Tips (2026)
Email marketing leads digital ROI at ~$42 per $1, with 392.5B emails/day and a market projected to grow from $13.2B (2024) to $36.3B (2033). Automation drives 37% of revenue from 2% of sends, and 55% of opens are mobile.
If you're wondering whether email marketing is still alive and kicking, contrary to what many people in the 21 century think, the answer is yes!
Email marketing has proven to be one of the most effective ways of communicating with customers.
Email marketing statistics for 2026 confirm the channel's dominance: businesses earn an average of $42 for every $1 spent (a 4,200% ROI), 392.5 billion emails are sent daily worldwide, and 55% of all opens now happen on mobile. These 50+ data points cover ROI benchmarks, engagement rates, automation performance, and B2B trends from the latest industry research.

What Are the Most Important Email Marketing Statistics for 2026?
• Email marketing generates an average return of $42 for every $1 spent, making it the highest-ROI digital channel — Litmus / Data & Marketing Association
• 392.5 billion emails are sent and received daily in 2026, up from 376 billion in 2025 — Charle Agency
• Automated email flows drive 37% of email-generated revenue despite being just 2% of total sends — Originality.ai
• 55% of all email opens now happen on mobile devices — Originality.ai
• 79% of B2B marketers rank email as their most effective content distribution channel — DemandSage
• The global email marketing market reached $13.2 billion in 2024 and is projected to hit $36.3 billion by 2033 — Originality.ai
How High Is the ROI of Email Marketing in 2026?
Email consistently outperforms every other digital marketing channel when measured by return on investment. The numbers aren't even close. While paid social and display ads fight over single-digit returns, email marketers routinely see returns that would make venture capitalists jealous. Here's what the data actually shows.
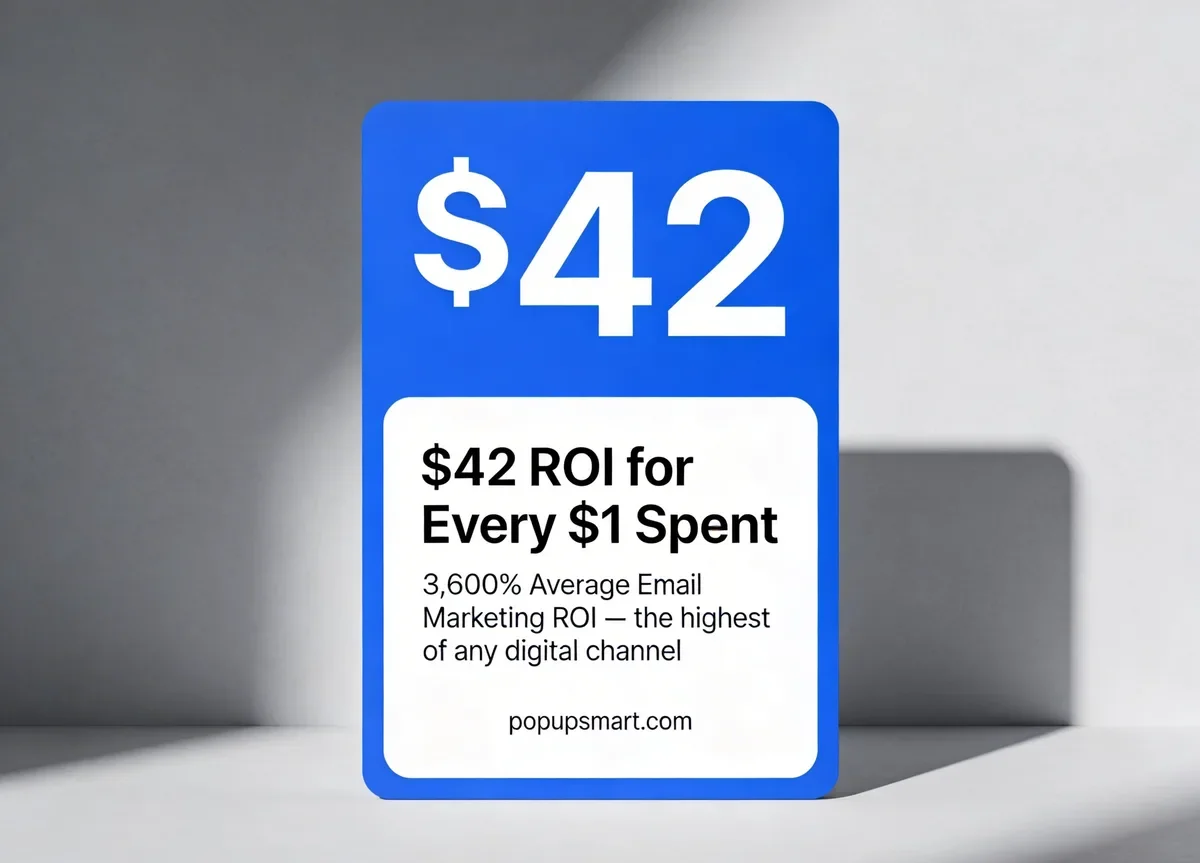
Email marketing delivers an average ROI of $42 for every $1 spent (Source: DMA)
Email marketing generates $42 for every $1 invested, according to the Data & Marketing Association. — Litmus (citing DMA research)
That's a 4,200% return. No other marketing channel comes close to this figure consistently. Paid search averages around $2 return per dollar, and social media ads hover between $1.50 and $3. The gap between email and everything else has actually widened over the past three years as ad costs climbed.
If you're allocating less than 20% of your marketing budget to email, run a 90-day test shifting 10% from your lowest-performing paid channel to email list building and automation. Track revenue per subscriber to measure the impact directly.
The average ROI for email marketing campaigns across the US and UK falls between 3,600% and 3,800%. — Email Monday
This range reflects variation across industries and company sizes, but even the low end of 3,600% dwarfs other channels. The UK tends to see slightly higher returns due to lower average send costs and higher engagement rates among European subscribers.
What to do: Calculate your own email ROI using this formula: (revenue from email - cost of email tools and labor) / cost of email tools and labor x 100. Compare your number against the 3,600% benchmark to identify where you're leaving money on the table.
Nearly 1 in 5 companies achieve email marketing ROI of 7,000% or more. — Email Monday
The top performers don't just send newsletters. They combine behavioral triggers, dynamic content, and aggressive segmentation. I've seen SaaS companies hit these numbers by focusing exclusively on lifecycle emails tied to product usage data. The secret? Sending fewer emails to more targeted segments.
Pro tip: Audit your current email segments. If you have fewer than five active segments, you're almost certainly under-targeting. Start by splitting your list by engagement level (active in last 30 days, 30-90 days, 90+ days) and tailor frequency and content accordingly.
72% of brands say email is their most effective marketing channel. — Forbes
This isn't just about ROI anymore. Brands are choosing email because they own the relationship. Algorithm changes on social platforms can wipe out organic reach overnight. Your email list is an asset you control. After years of watching Facebook and Instagram throttle organic reach, marketers are returning to the channel that doesn't charge rent.
Tip: Add email list building tactics to every customer touchpoint, including your homepage, blog posts, checkout flow, and support pages. Growing your owned audience protects against platform dependency.
80% of marketers say they'd rather give up social media than email marketing. — DemandSage
This stat gets repeated a lot, but think about what it actually means. Four out of five professionals who do this for a living would sacrifice their Instagram, LinkedIn, and TikTok presence before their email program. That's not loyalty. That's a cold, revenue-driven calculation.
How Big Is the Email Marketing Industry in 2026?
The email marketing industry is growing faster than most marketers realize. What started as a simple communication tool now powers a multi-billion dollar ecosystem of platforms, agencies, and service providers. These market size figures put the scale of that growth into perspective.
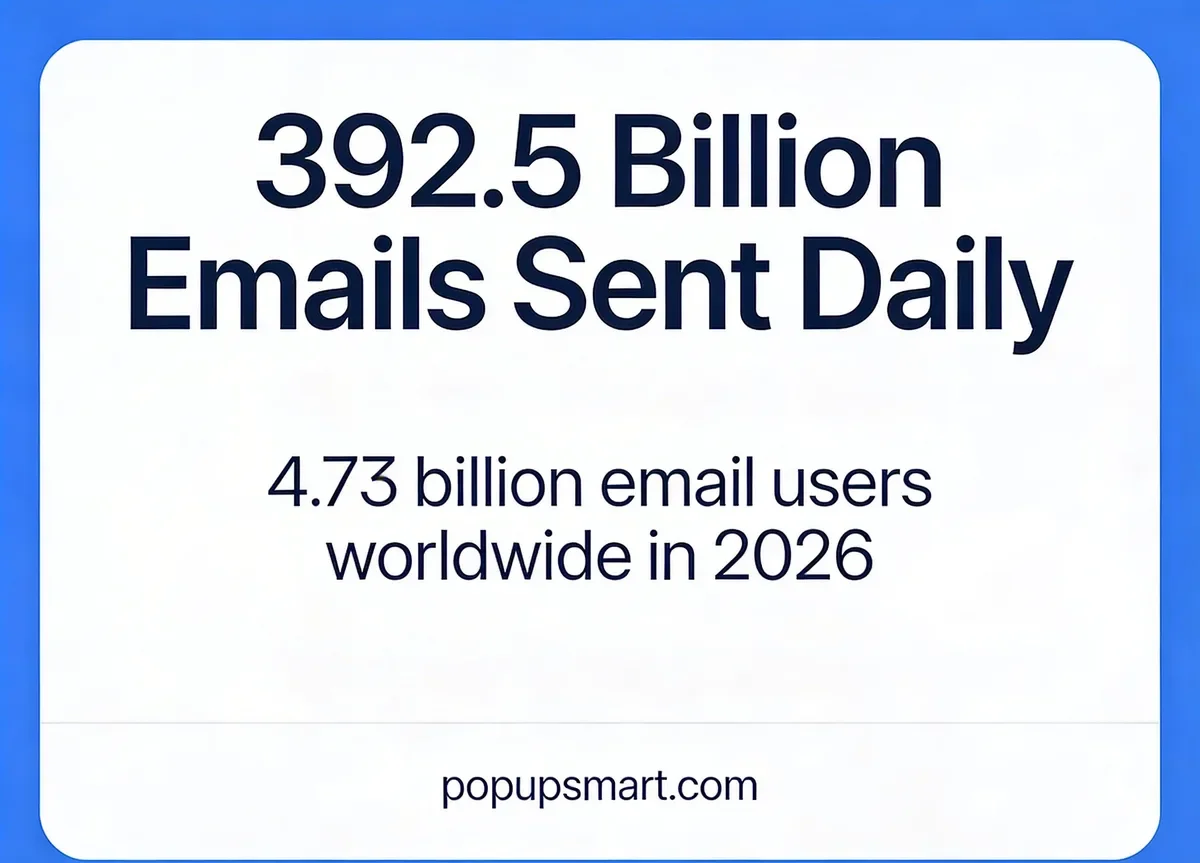
In 2026, 392.5 billion emails are sent and received daily worldwide (Source: Charle Agency)
The global email marketing market reached $13.2 billion in 2024 and is projected to grow to $36.3 billion by 2033. — Originality.ai
That compound annual growth rate tells you something the "email is dead" crowd doesn't want to hear: investment in email infrastructure, tools, and talent is accelerating, not slowing. The growth comes from AI-powered personalization tools, better deliverability infrastructure, and the shift toward first-party data as third-party cookies disappear.
Tip: Invest in your email tech stack now. If you're still on a basic ESP, evaluate platforms with built-in automation, A/B testing, and analytics capabilities that match where the industry is heading.
There are 4.73 billion email users worldwide in 2026. — Charle Agency
That's roughly 58% of the global population. No other digital communication channel reaches this many people. Not WhatsApp, not Instagram, not TikTok. Email is the universal ID of the internet, and every new online account you create starts with an email address.
392.5 billion emails are sent and received daily in 2026, translating to over 3.13 million emails per second. — Charle Agency
The sheer volume means standing out requires more than a clever subject line. Competition for inbox attention is fierce, but it also validates that email remains the preferred communication medium for both personal and business interactions.
Pro tip: Focus on deliverability and sender reputation as your top priority. With 392.5 billion daily emails, inbox providers are more aggressive than ever with spam filtering. Authenticate your domain with SPF, DKIM, and DMARC if you haven't already.
48% of all emails sent globally are classified as spam. — MarketingProfs
Nearly half of all email traffic is junk. This matters for legitimate senders because spam filters are getting more aggressive. Shared IP addresses, weak authentication, and low engagement rates push even legitimate emails toward the spam folder.
What to do: Monitor your sender score monthly. Clean your list every quarter by removing subscribers who haven't opened an email in 90 days. A smaller, engaged list outperforms a large, disengaged one every time.
What Are the Average Email Open and Click-Through Rates?
Open rates and click-through rates are the two metrics every email marketer watches obsessively, and for good reason. They tell you whether your subject lines work and whether your content drives action. As someone who tracks these numbers for clients daily, I can confirm the benchmarks shift more than most roundups acknowledge.
The average email open rate across all industries is 42.35%, and the average click-through rate is 2%. — Moosend
That 42.35% figure is higher than what many marketers expect because Apple's Mail Privacy Protection (MPP), introduced in 2021, inflates open rates by pre-loading tracking pixels. The real behavioral open rate is likely closer to 25-30%. The 2% CTR, though, is a harder metric to fake and a better indicator of actual engagement.
Stop obsessing over open rates as your primary KPI. Shift to click-through rate and click-to-open rate (CTOR) as your engagement benchmarks. A 2% CTR baseline means you should be optimizing for clicks, not opens.
A "good" email CTR typically falls between 2% and 5%, though industry benchmarks vary significantly. — Salesforce
B2B emails tend toward the lower end (1.5-3%) because decision cycles are longer and audiences are more selective. E-commerce emails push higher (3-5%) thanks to product imagery and urgency-driven offers. If you're below 2%, your content or targeting needs work. If you're above 5%, you're doing something worth documenting.
Tip: Benchmark your CTR against your specific industry, not the global average. Compare your numbers against B2B email marketing benchmarks if you're in SaaS or B2B to get an accurate picture of where you stand.
86% of respondents said they have at least three email addresses. — ZeroBounce
Multiple email addresses means your subscribers are sorting their digital lives into categories: work, personal, newsletters, and junk. If your marketing emails land in the "junk" address, engagement will always be low regardless of content quality.
42% of email users check their inboxes three to five times per day. — ZeroBounce
Frequent inbox checking creates multiple daily windows to reach your audience. But it also means people scan quickly and delete fast. You have roughly 2-3 seconds to convince someone your email is worth opening based on the subject line and preview text alone.
What to do: Front-load value in your subject line and preview text. The first 40 characters of your subject line and 90 characters of preview text are what most email open rate optimization comes down to on mobile.
How Does Email Compare to Social Media for Marketing?
The email vs. social media debate isn't really a debate anymore. The data consistently shows email outperforming social on the metrics that matter most: conversions, ROI, and customer acquisition cost. But the comparison is still worth examining because budget allocation decisions depend on understanding these differences.
Email is almost 40 times more effective than Facebook and Twitter combined for customer acquisition. — DemandSage
This isn't about reach. Social media wins on reach. This is about converting a stranger into a customer. Email wins because the subscriber has already opted in, creating a permission-based relationship that social media followers don't have. The intent signal is fundamentally different.
Idea: Use social media for awareness and email for conversion. Build a funnel where social content drives lead generation into your email list, then let email sequences handle nurturing and conversion.
52% of consumers have made a purchase directly from an email they received. — Reddit (citing industry benchmarks)
More than half of consumers have pulled out their credit card because of an email. Social media posts drive discovery, but email drives decisions. The one-to-one nature of email creates a private context where purchasing feels natural rather than performative.
Email CTR in Belgium and Germany was 5.5% and 4.3% respectively, while global social media CTR averaged just 1.3%. — Campaign Monitor
Even in the best-performing social markets, email CTR quadruples social media engagement. This gap widens for B2B content where social feeds are noisy and attention spans are fractured across platforms.
What Do Email Engagement and Subscriber Behavior Statistics Show?
Raw engagement numbers tell you what subscribers actually do with your emails, not what marketers hope they'll do. These behavioral statistics shaped how we think about email frequency, list hygiene, and content strategy at Popupsmart when advising clients on cold email and outreach campaigns.
99% of email users check their inbox every day, with some checking as many as 20 times daily. — Luisa Zhou
Daily inbox checking is a deeply embedded habit. This makes email one of the few channels where you can reliably expect your message to at least appear in front of your audience within 24 hours. Social algorithms can suppress posts for days or permanently.
Quick tip: Test send-time optimization. If 99% of your list checks email daily, the question isn't whether they'll see it but when. Use your ESP's send-time optimization feature to deliver emails when individual subscribers typically engage.
93% of respondents use email every day. — ZeroBounce
This confirms that email isn't just common. It's a daily utility. Unlike apps that spike and fade (remember Clubhouse?), email usage remains stable year after year because it's tied to fundamental activities like account creation, work communication, and financial notifications.
64% of small businesses use email marketing to reach customers. — Luisa Zhou
That means 36% still don't. If you're a small business not using email, you're handing a direct communication line to competitors who are. The barrier to entry has never been lower, with free tiers available from every major ESP.
The average value of a customer email address in the UK is £36.64. — Reddit (citing DMA UK data)
Every subscriber on your list has a measurable monetary value. Knowing this number for your own business changes how you think about list growth investments. If each email address is worth £36.64, spending £5-10 to acquire one through targeted popups or content upgrades is a no-brainer.
What to do: Calculate your revenue per subscriber (total email revenue / total active subscribers). Use that number to set your maximum cost-per-acquisition for email list building and justify budget requests to leadership.
What Are the Key Email Automation and Personalization Statistics?
Automation and personalization are where email marketing ROI really compounds. Batch-and-blast newsletters still work, but automated sequences triggered by subscriber behavior generate disproportionate revenue..
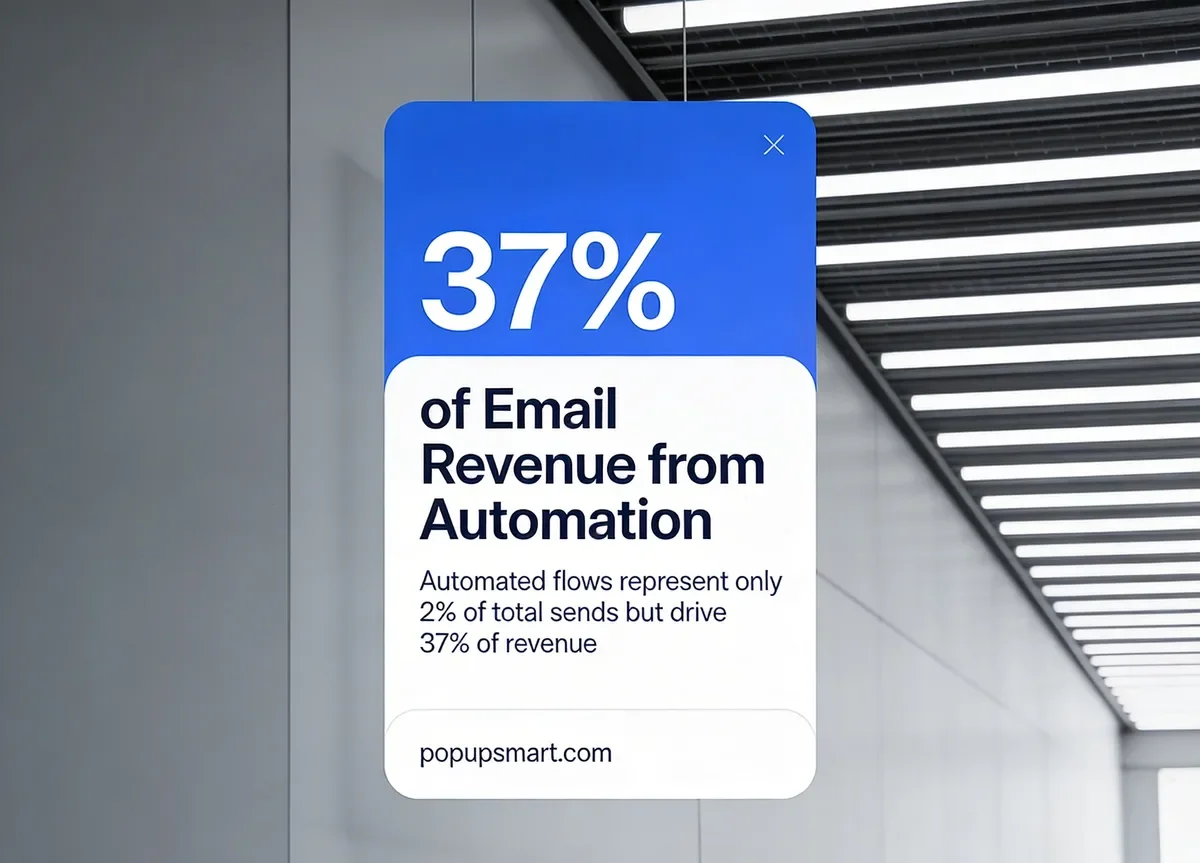
Automated email flows drive 37% of email-generated revenue despite being just 2% of total sends (Source: Originality.ai)
Automated email flows drive 37% of email-generated revenue while representing just 2% of total email sends. — Originality.ai
Read that ratio again: 2% of volume, 37% of revenue. Automated flows (welcome series, abandoned cart, post-purchase) are 18.5x more revenue-efficient per send than regular campaigns. The reason is timing. These emails arrive when the subscriber's intent is highest.
If you only have time for one email project this quarter, build an abandoned cart sequence. It's the single highest-converting automation. Pair it with browse abandonment emails for an additional recovery layer.
Personalized subject lines are 22.2% more likely to be opened. — Salesforce
A 22% lift from something as simple as inserting a first name or referencing a recent purchase. But personalization goes far beyond names. Dynamic content blocks, product recommendations based on browsing history, and location-specific offers all compound this effect.
Tip: Start with subject line personalization (first name, company name, or recent action), then graduate to dynamic email body content. Even basic segmentation by industry or company size lifts B2B engagement metrics significantly.
Professional marketers have found a 760% increase in revenue from building email lists and using email campaigns. — Luisa Zhou
The 760% figure reflects the compound effect of growing a permission-based list and nurturing it with relevant content over time. It's not a one-time spike. It's the result of steady list growth, consistent sending, and progressive optimization. The brands achieving these numbers treat email as a long-term revenue engine, not a promotional megaphone.
How Does Mobile Email Usage Affect Marketing Strategy?
Mobile email consumption has been growing for years, but 2026 marks a tipping point. More than half of all email opens now happen on phones and tablets, which fundamentally changes how you should design, write, and time your campaigns.
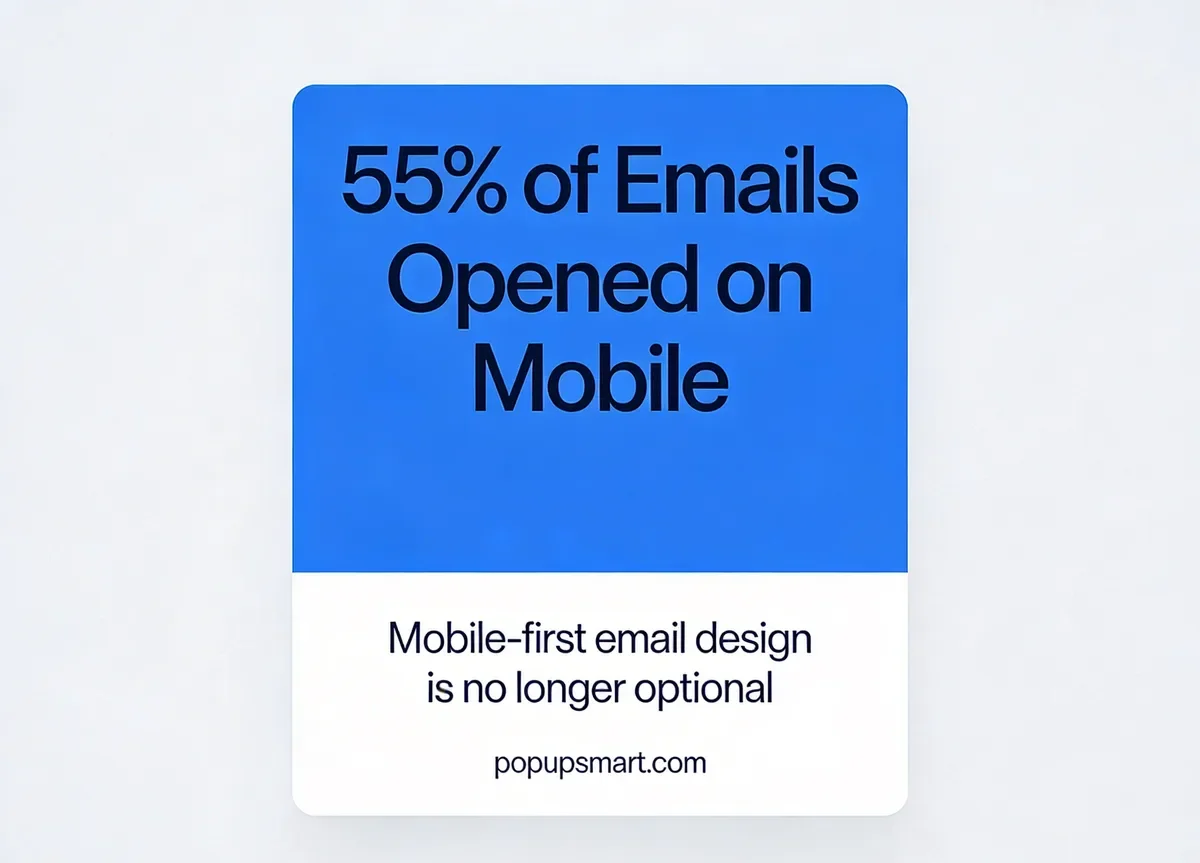
55% of all email opens now happen on mobile devices (Source: Originality.ai)
55% of all email opens now happen on mobile devices. — Originality.ai
The majority of your subscribers read your emails on a screen that's roughly 6 inches wide. That has direct implications for everything: subject line length (keep it under 40 characters), preview text (first 90 characters matter most), CTA button size (minimum 44x44 pixels), and single-column layouts. Designing for desktop first and hoping it "works on mobile" is backward.
What to do: Switch to mobile-first email design if you haven't already. Test every email on at least three mobile devices before sending. Use mobile-optimized forms for email capture to match the device your subscribers actually use.
The number of outbound emails increased 15% in the last year, and email continues to make up over 80% of all outbound business messaging. — Dyspatch
Email volume is growing because it works. But the 15% increase in outbound also means more competition for inbox space on those small mobile screens. Subject line quality and sender reputation matter more than ever when subscribers are scrolling through a packed inbox on their commute.
What Do B2B Email Marketing Statistics Reveal?
B2B email marketing operates under different rules than B2C. Sales cycles are longer, buying committees have multiple stakeholders, and content expectations skew toward education over entertainment. The data below reflects these differences and should inform how B2B SaaS companies approach their email programs.
79% of B2B marketers say email is their most successful content distribution channel. — DemandSage
Email beats LinkedIn, paid search, and content syndication for B2B content distribution. The reason is simple: B2B buyers subscribe to industry newsletters and vendor updates intentionally. They're signaling interest by opting in, which makes email the most qualified distribution channel available.
What to do: Create a content-driven newsletter separate from your product updates. B2B subscribers stay engaged when they're learning, not when they're being sold to. Share industry data, original research, and operational insights rather than feature announcements.
77% of B2B buyers prefer to receive communication from vendors via email. — MarketingProfs
Cold calls, LinkedIn DMs, and direct mail all rank below email for B2B buyer preference. Email gives buyers control. They can read on their schedule, forward to colleagues, and reference past messages during purchasing decisions. That convenience translates directly into higher response rates for email-first outreach strategies.
82% of marketers worldwide use email marketing as part of their strategy. — Luisa Zhou
The near-universal adoption means email isn't a competitive advantage by itself. The advantage comes from how well you execute: segmentation quality, content relevance, send timing, and automation sophistication. Doing email badly is almost worse than not doing it at all because it trains subscribers to ignore you.
Email marketing delivers the highest ROI among all channels, according to US and UK marketers surveyed by eMarketer. — eMarketer
When marketers across both countries independently identify the same channel as the ROI leader, that's a signal worth paying attention to. The consistency across geographies suggests this isn't a regional anomaly. Email's ROI advantage is structural, driven by low cost-per-send and high intent from opted-in audiences.
What Are the Best Email Types and Send Times?
Not all emails perform equally. Welcome sequences, triggered messages, and time-sensitive reminders each have distinct engagement profiles. Knowing which email types work best and when to send them can double your results without changing your list size or content quality.
Welcome emails have an average open rate above 83.63% and an average CTR around 16%. — GetResponse
An 86% open rate is extraordinary. No other email type comes close. Welcome emails perform this well because they arrive when interest peaks. Someone just signed up, and they want to see what they're getting. This is your single best opportunity to make a strong first impression and set expectations for future emails.
What to do: Build a 3-email welcome sequence. Email 1 (immediate): deliver the promised content or confirmation. Email 2 (day 2): share your best-performing content piece. Email 3 (day 4): introduce your product with a soft CTA. I've seen this sequence consistently generate 3-5x the engagement of a single welcome email.
Triggered email campaigns are the most effective, with a 38.03% open rate, 6.76% CTR, and 0.43% unsubscribe rate. — GetResponse
Triggered emails (cart abandonment, post-purchase, re-engagement) outperform batch campaigns across every metric. The 6.76% CTR is more than triple the industry average. Low unsubscribe rates (0.43%) confirm that subscribers find these messages relevant rather than intrusive.
Shorter email campaigns perform better: single-message autoresponder cycles achieve a 98.39% open rate and 37.26% CTR. — GetResponse
Brevity wins. Long multi-email sequences show diminishing engagement after the first 2-3 messages. The 98.39% open rate on single-message autoresponders reflects perfectly timed delivery to a highly engaged audience. Don't confuse this with batch campaigns. Autoresponders are triggered by a specific action, which guarantees relevance.
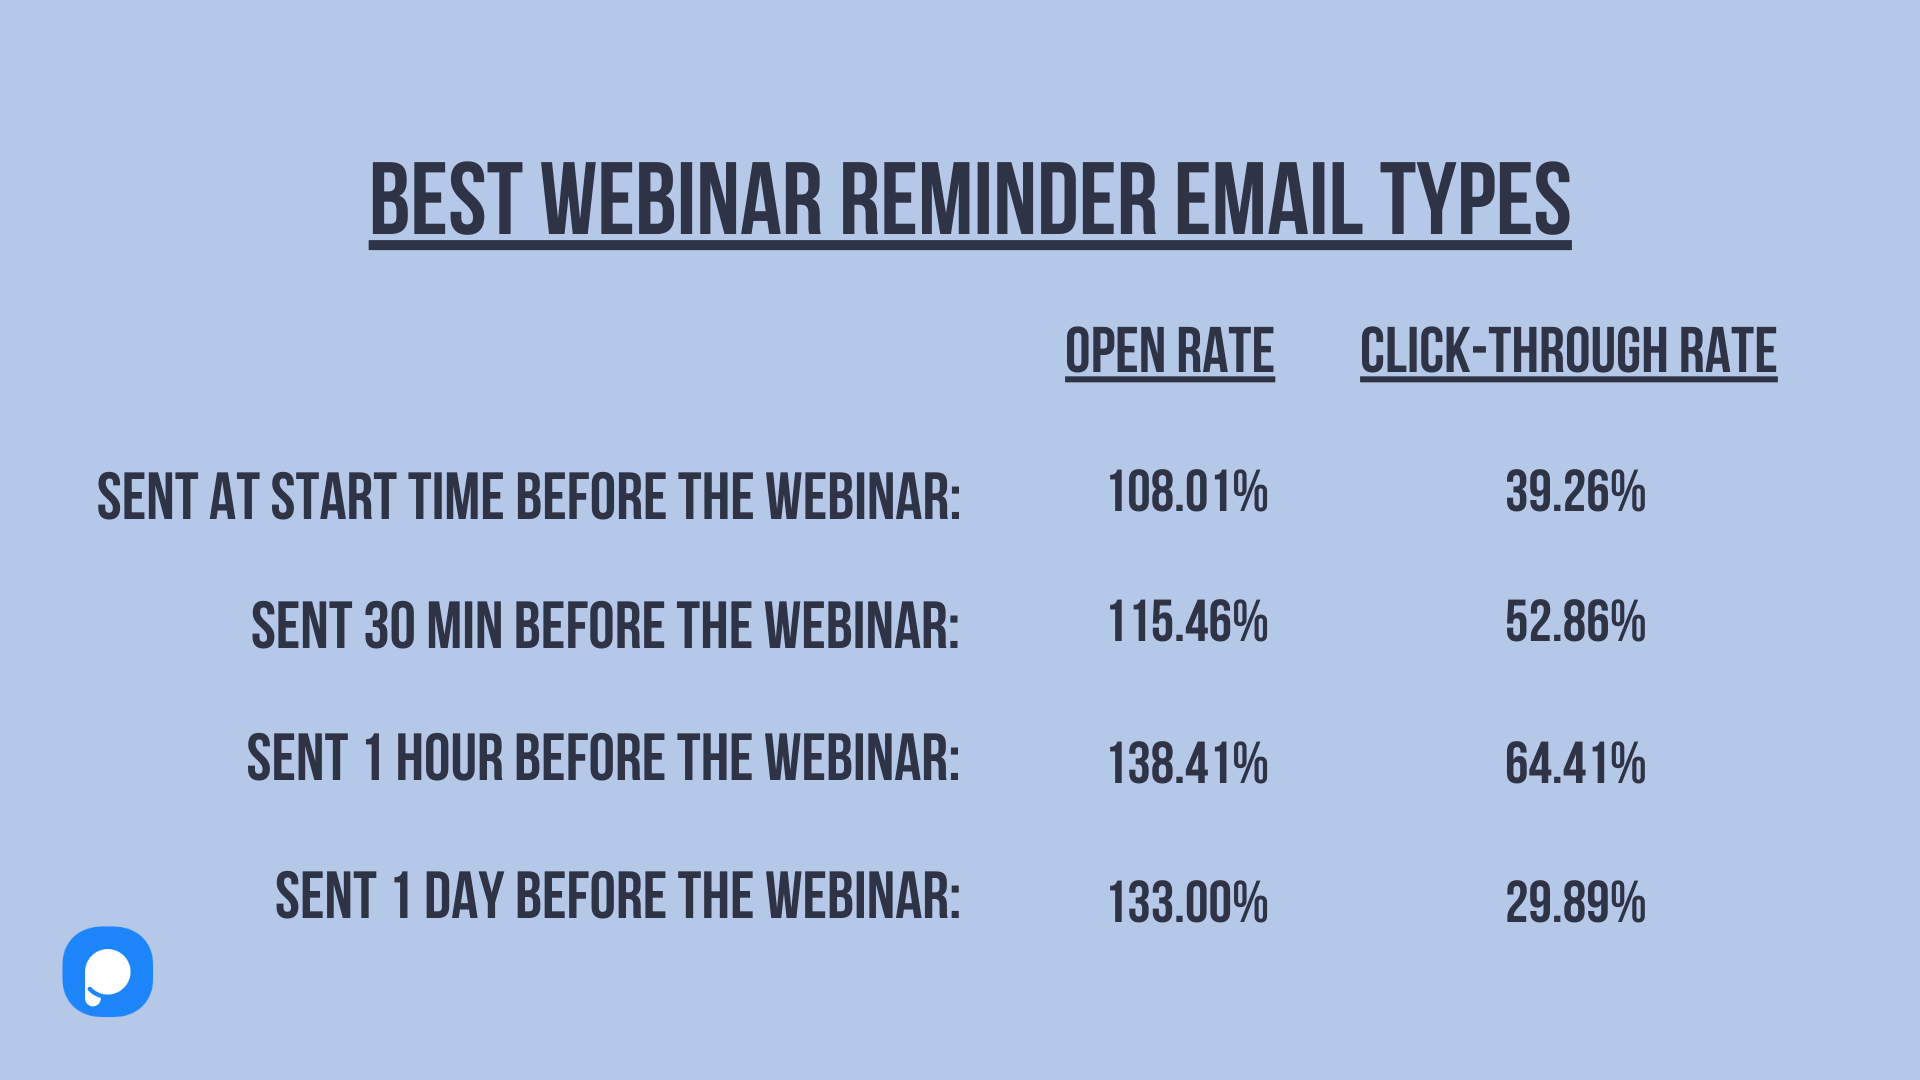
Webinar reminder emails sent 1 hour before the event achieve a 138.41% open rate and 64.41% CTR. — GetResponse
Open rates above 100% happen when recipients open the same email multiple times. A 64.41% CTR means nearly two-thirds of openers click through to join. Timing is everything for event-based emails.
Almost 22% of all email campaigns are opened within the first hour after sending. — GetResponse
If your email doesn't get opened in the first hour, its chances drop dramatically with each passing hour. This rapid decay pattern makes send-time optimization one of the most impactful tweaks available to email marketers.
How Are Email Marketing Industry Benchmarks Changing by Sector?
Industry-level benchmarks matter because a "good" open rate in e-commerce is mediocre in education. These sector-specific numbers from Mailchimp's benchmark database help you compare your performance against your actual peers, not a generic average.
| Industry | Open Rate | CTR | Unsubscribe Rate |
|---|---|---|---|
| Education | 35.64% | 3.02% | 0.18% |
| Government and Politics | 36.89% | 2.80% | 0.13% |
| Nonprofits | 40.04% | 3.27% | 0.18% |
| Business and Finance | 31.35% | 2.78% | 0.15% |
| E-Commerce | 29.81% | 1.74% | 0.19% |
| All Industries Average | 35.63% | 2.62% | 0.22% |
Nonprofits lead with a 40.04% open rate and 3.27% CTR, reflecting emotionally invested audiences who care deeply about the cause. E-commerce sits lower at 29.81% open rate because promotional fatigue is real. If you're in SaaS or B2B, benchmark against Business and Finance (31.35% open, 2.78% CTR) for the most relevant comparison.
Tip: Pull your last 90 days of email data and compare against your industry column. If your open rate is within 5 percentage points of the benchmark, your subject lines are performing adequately. If your CTR is below benchmark, focus on email content, CTA placement, and offer relevance.
E-commerce emailers earn an average annual revenue of $6.86 per subscriber. — Reddit (citing industry data)
At $6.86 per subscriber, a 10,000-person email list generates roughly $68,600 in annual email revenue. That number goes up dramatically with better segmentation and automation. Top-performing e-commerce brands we've worked with hit $15-25 per subscriber by combining behavioral triggers with personalized product recommendations.
What Email Marketing Trends Will Shape 2026 and Beyond?
Three forces are reshaping email marketing right now: privacy regulation, AI integration, and the shift from campaign-based to lifecycle-based email programs. These aren't predictions. They're trends already showing up in the data.
Privacy-compliant tracking is the top email marketing trend for 2026. — Litmus
Apple's MPP already broke traditional open tracking. Now Google is rolling out similar protections. Forward-thinking email teams are moving to click-based engagement metrics, zero-party data collection (surveys, preference centers), and conversion tracking rather than pixel-based opens. The marketers who adapt fastest will have the most accurate data.
Generative AI is being applied to every part of the email workflow. — Litmus
AI tools now write subject lines, generate email copy, optimize send times, clean lists, and predict churn. But the winning approach isn't replacing humans with AI. It's using AI for the repetitive tasks (A/B test generation, send-time optimization) so marketers can focus on strategy and creative direction.
Lifecycle email is replacing campaign-based email as the dominant strategy. — Litmus
Campaign email (monthly newsletters, promotional blasts) still matters, but lifecycle email (triggered by customer behavior and journey stage) is where the growth is happening. The 37% revenue from 2% of sends stat we covered earlier is a direct result of this shift. Smart marketers are building systems, not just campaigns.
Standing out in a crowded marketplace remains the top challenge for 46.67% of brands. — Forbes
Nearly half of all brands say differentiation is their biggest problem. In email, differentiation comes from personalization, unique content, and brand voice. Generic templates and stock content won't cut it when your subscribers receive 100+ emails per day. Use tools like email marketing apps for Shopify that enable dynamic content and advanced segmentation to stand out.
What Are Real-World Email Marketing Case Study Results?
Aggregated statistics tell you what's possible. Case studies tell you what specific companies actually achieved. These results come from documented implementations with named brands and measurable outcomes.
Skinny Fizz, a New Zealand beverage company, saw email revenue jump by 921% and click rates improve by 101.49% after restructuring their email program. — In-box
A 921% revenue increase sounds like an outlier, but the starting baseline matters. Skinny Fizz was underutilizing email before the restructure. The lesson isn't that everyone will see 921% growth. It's that companies with underdeveloped email programs have the most to gain from strategic optimization.
Neurogan, a CBD industry company, grew year-over-year revenue by 76% and saw email open rates jump by 20% after email strategy overhaul. — In-box
The CBD industry faces unique marketing challenges. Social media advertising is restricted, paid search is expensive, and marketplace options are limited. Email became Neurogan's primary growth channel precisely because other channels were constrained. This is a pattern I've seen with other regulated industries too.
Med&Beauty, a Polish clothing brand, generated $43K from 10 newsletters with an 873% ROI in five months. — GetResponse
Ten newsletters producing $43K means roughly $4,300 per send. That level of revenue per campaign comes from a well-segmented list, strong product-content fit, and offers timed to purchase cycles. The 873% ROI tracks closely with industry benchmarks, confirming that real-world results align with the broader data.
DAAG recovered $25,200 through abandoned cart emails alone, on top of $139K from regular newsletters. — GetResponse
The $25,200 in recovered cart revenue represents sales that would have been lost without automation. This is found money. The cost of setting up an abandoned cart email sequence is minimal compared to the revenue it recovers.
How Is Email Marketing Popularity Distributed Across Generations?
Generational preferences shape how you target and message different audience segments. The assumption that "young people don't use email" is flat wrong, but their relationship with email is different from older demographics.
79% of millennials and 57% of Gen Z respondents in the US like being contacted by brands via email. — Statista (US Consumer Survey)
Gen Z's 57% preference for brand email might surprise marketers who assume this generation lives exclusively on TikTok and Instagram. But think about it: Gen Z grew up with email as a requirement for every account, school assignment, and job application. They use it differently than millennials (more transactional, less browsing), but they absolutely use it.
Tip: Segment your email content by generation when possible. Gen Z responds to shorter, more visual emails with direct CTAs. Millennials engage with longer-form content and educational material. Tailor your approach to each group rather than sending one-size-fits-all campaigns.
31% of marketers currently use email marketing as part of their strategy, according to HubSpot. — HubSpot
This lower percentage from HubSpot's data likely reflects a different survey methodology than the 82% figure cited elsewhere. The discrepancy probably comes from how "use email marketing" is defined. If you include basic newsletters, the number is high. If you require strategic, automated email programs, it drops. Either way, there's enormous room for growth.
How We Compiled Email Marketing Statistics
This compilation draws from 30+ sources including Litmus, DMA, Charle Agency, Mailchimp, GetResponse, Salesforce, ZeroBounce, Forbes, MarketingProfs, DemandSage, Moosend, and eMarketer. We deliberately avoided single-source dependency by cross-referencing claims across at least two independent datasets wherever possible.
The hardest part of compiling email marketing statistics in 2026 is the open rate reliability problem. Apple's Mail Privacy Protection, launched in September 2021, pre-fetches tracking pixels regardless of whether the recipient actually reads the email.
We've noted which metrics are affected and prioritized click-based and revenue-based statistics that aren't susceptible to MPP inflation. Statistics labeled with specific years reflect data collected during those periods. Where a source didn't specify the data collection year, we verified recency through the publication date and cross-checked against other sources reporting similar figures.
What These Email Marketing Statistics Mean for Your Strategy
Email marketing in 2026 isn't just surviving. It's pulling further ahead of every other digital channel on the metrics that matter: ROI, reach, and subscriber value. The $42-per-dollar return figure is often quoted but rarely acted upon with the urgency it deserves.
The most actionable insight is the automation gap. Automated flows generating 37% of revenue from 2% of sends means the vast majority of email programs are leaving money on the table by relying too heavily on manual campaigns. If you build just three automated sequences this year (welcome, cart abandonment, and post-purchase), you'll capture the lion's share of that automated revenue potential.
Mobile-first design isn't optional anymore. With 55% of opens on mobile and growing, every email you send should be designed for a 6-inch screen first and adapted for desktop second. Pair that with the send-time data (22% of opens in the first hour) and you have a clear execution framework: send the right message, at the right time, formatted for the right device.
For B2B SaaS companies specifically, the 77% buyer preference for email communication means your email program is your primary sales channel whether you've designed it that way or not. Invest accordingly. Build a data-driven marketing strategy that puts email at the center, not the periphery.
Start by auditing your current email metrics against the benchmarks in this post. Identify the biggest gap between your performance and the industry standard, then tackle that gap first. Small, focused improvements compound fast in email marketing because every optimization applies to every future send.
FAQ About Email Marketing Statistics
What is the average open rate for email marketing?
The average email open rate across all industries is 42.35% according to Moosend, though this figure is inflated by Apple's Mail Privacy Protection which pre-loads tracking pixels. Mailchimp's industry-specific data shows ranges from 29.81% for e-commerce to 40.04% for nonprofits. The real behavioral open rate (people actually reading your email) is likely closer to 25-30%. For B2B email benchmarks, expect open rates around 31-35% depending on your niche.
What is a good ROI for email marketing campaigns?
The industry benchmark is $42 return for every $1 spent, which translates to a 4,200% ROI according to the Data & Marketing Association. However, results vary dramatically by execution quality. The average falls between 3,600% and 3,800% for US and UK marketers. Nearly 1 in 5 companies achieve ROI of 7,000% or higher by combining behavioral automation, advanced segmentation, and personalized content. If your email ROI is below 2,000%, your program likely needs optimization in list quality, segmentation, or automation.
What is the 80/20 rule in email marketing?
The 80/20 rule states that 80% of your email content should provide value (educational content, tips, industry news, resources) and only 20% should be directly promotional (product pitches, sales offers, discount codes). This ratio keeps subscribers engaged over time because they associate your emails with useful content rather than constant selling. Companies that flip this ratio and send 80% promotional content typically see unsubscribe rates 3-4x higher than industry averages.
What is a good click rate for email marketing?
A good email click-through rate falls between 2% and 5% according to Salesforce, though this varies by industry. B2B emails typically see 1.5-3% CTR, while e-commerce ranges from 1.74% to 5% depending on offer relevance and list quality. The all-industry average sits at about 2% according to multiple sources including Moosend. If you're consistently below 2%, focus on improving your CTA clarity, email design, and audience segmentation.

How would you rate your experience with this article? 😊