Landing Page Statistics 2026 (Key Insights)
Median landing page conversion rate is 6.6% across industries, with top performers near 26% and big variation by sector. Key levers include more targeted pages, faster mobile-friendly speed, shorter forms, personalization, social proof, and iterative A/B testing.
The average landing page conversion rate is 6.6% across industries, but top performers hit 10% or higher through targeted optimization. Personalized CTAs lift conversions by 202%, and scaling from 10 to 15 landing pages drives a 55% jump in leads. These landing page statistics cover conversion benchmarks, design factors, mobile performance, and trends shaping pages that convert.
Landing pages are tricky, but we have curated the best statistics to help you increase your conversions and achieve your business goals.
What Is the Average Landing Page Conversion Rate?
The median landing page conversion rate across all industries is 6.6%, though this number masks wide variation depending on sector, traffic source, and offer type. Before digging into specific benchmarks, it's worth understanding what "conversion rate" actually measures and why the industry average only tells part of the story.
A landing page conversion rate is the percentage of visitors who complete a desired action (form fill, purchase, signup) divided by total page visitors. If 1,000 people visit your page and 66 convert, that's a 6.6% conversion rate.
Average landing page conversion rate benchmark across industries
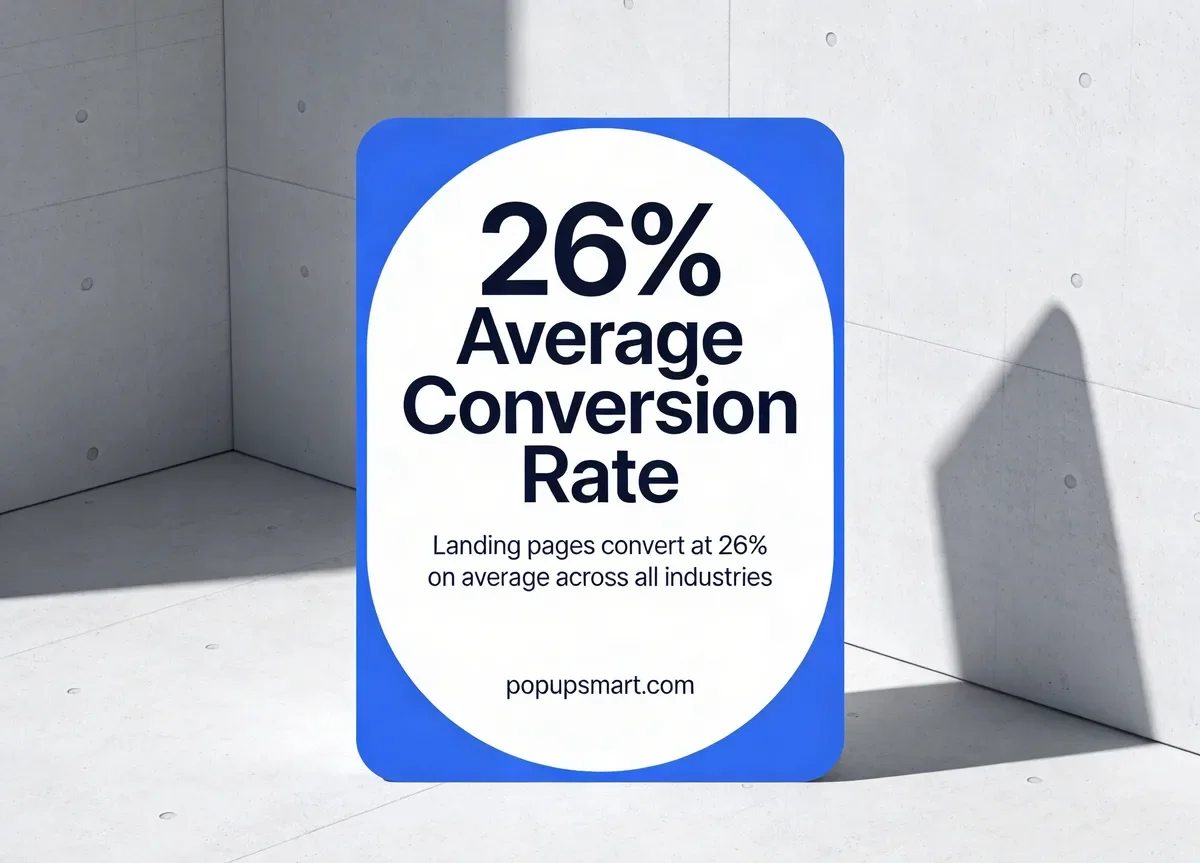
The average conversion rate of a landing page is 26% when measuring top-performing pages with optimized funnels. — Email Vendor Selection (2026 data compilation)
That 26% figure represents the upper tier, not the typical result. Most marketers land closer to the 6.6% median that Involve.me's 2026 analysis reports. The gap between average and top performers is where optimization effort pays off most.
What to do: Benchmark your own pages against the 6.6% median first. If you're below it, start with the basics (page speed, CTA clarity, form length). If you're above it, shift focus to personalization and A/B testing to push toward the 10%+ tier.
How Do Conversion Rates Differ by Industry?
Conversion rates swing dramatically by industry. A page converting at 3% might be underperforming in SaaS but outperforming in real estate. Knowing your industry's baseline prevents you from chasing the wrong number.
67% of all marketers achieve a conversion rate of over 10% for their landing pages. — Email Vendor Selection
That two-thirds figure sounds encouraging, but it skews toward marketers who actively track and optimize. The remaining 33% aren't necessarily failing; they may be in industries with lower natural baselines or running brand awareness campaigns where direct conversion isn't the primary KPI.
| Industry | Median Conversion Rate | Top Performer Benchmark |
|---|---|---|
| B2B SaaS | 6.6% | 10%+ |
| E-commerce | 2.5–3.5% | 5%+ |
| Finance - Insurance | 5.0% | 11.2% |
| Healthcare | 3.6% | 8%+ |
| Education | 5.8% | 13%+ |
| Travel - Hospitality | 4.8% | 10%+ |
According to First Page Sage's industry analysis, B2B companies generally see higher rates on lead-gen pages because the ask (email, demo request) carries less friction than an e-commerce purchase.
Tip: Pull your own conversion data from the last 90 days and compare it against your industry column above. If you're within 80% of the median, focus on incremental gains (headline testing, CTA color). If you're below 50% of the median, audit for structural problems: slow load times, unclear value props, or mismatched traffic sources. For a broader conversion rate context, check out our average website conversion rate benchmarks.
What Impact Does Landing Page Volume Have on Lead Generation?
More landing pages means more entry points for different audience segments, search queries, and ad campaigns. The relationship between page count and lead volume isn't linear, but the data consistently shows that scaling up pays off.
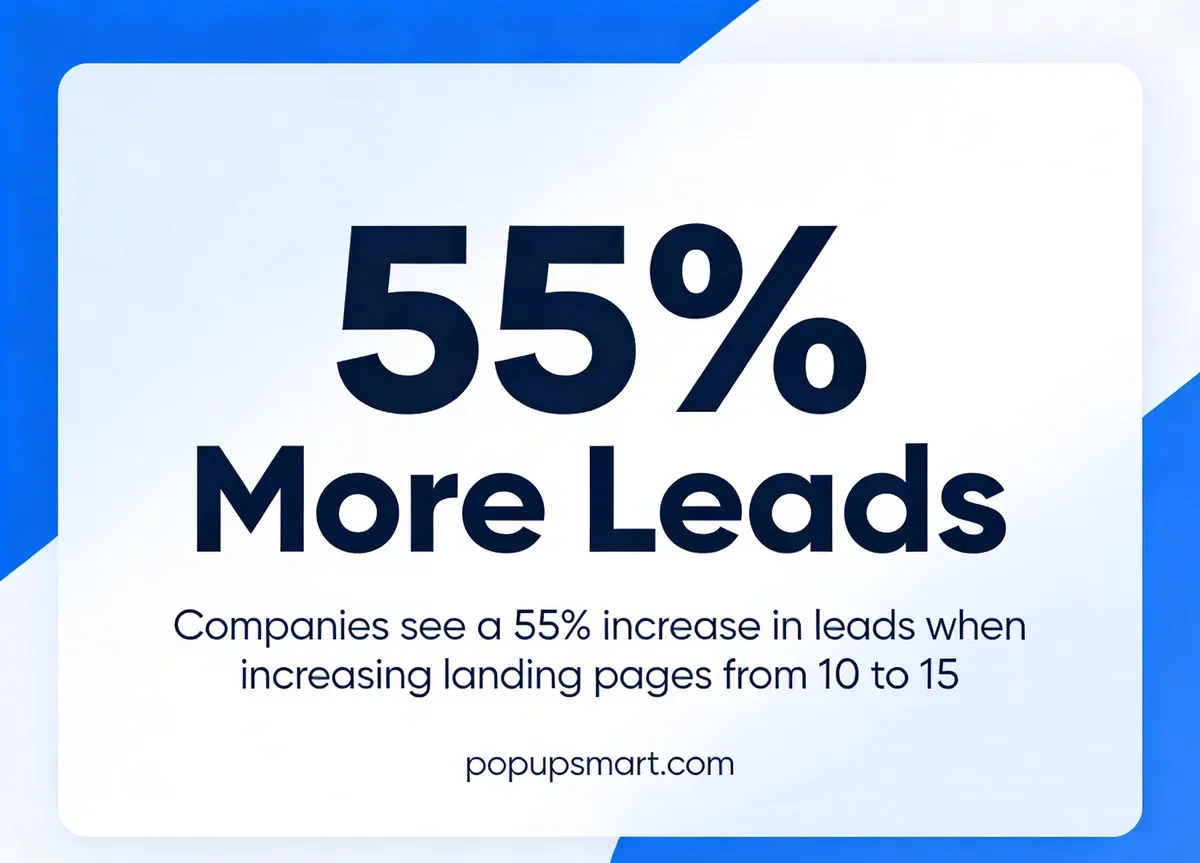
Scaling landing pages from 10 to 15 drives a 55% lead increase
Companies see a 55% increase in leads when they scale from 10 to 15 landing pages. — HubSpot
That 55% jump with just 5 additional pages is one of the most widely cited landing page statistics for good reason. Each new page can target a specific keyword, persona, or campaign. Instead of sending all PPC traffic to one generic page, you're matching intent more precisely.
What to do: Audit your current landing page count. If you're running fewer than 10, start by creating dedicated pages for your top 5 traffic sources or campaign themes. Each page should have a single, clear offer matched to the audience segment. Our guide to creating landing pages walks through the full setup process.
Businesses with 21 to 40 landing pages experience nearly a 300% increase in conversions compared to those with fewer pages. — Salesgenie
The 300% figure comes from HubSpot's original research, frequently cited across the industry. It reinforces the same principle at a larger scale: segmentation drives results. That said, 40 landing pages only work if each one serves a distinct purpose. Duplicating the same offer across 40 pages with minor wording changes won't produce this effect.
Pro tip: Map your buyer journey from awareness to decision, then identify where you're missing a dedicated landing page. Common gaps include product-specific pages (one per feature or use case), industry-specific pages (one per vertical you serve), and campaign-specific pages (one per ad group). Prioritize the gaps where you already have traffic but no tailored page.
How Does Copy Length Affect Landing Page Readability?
Short copy works for simple offers. Long copy works for complex products. The data shows the relationship isn't about word count alone; it's about matching depth to the decision being made.
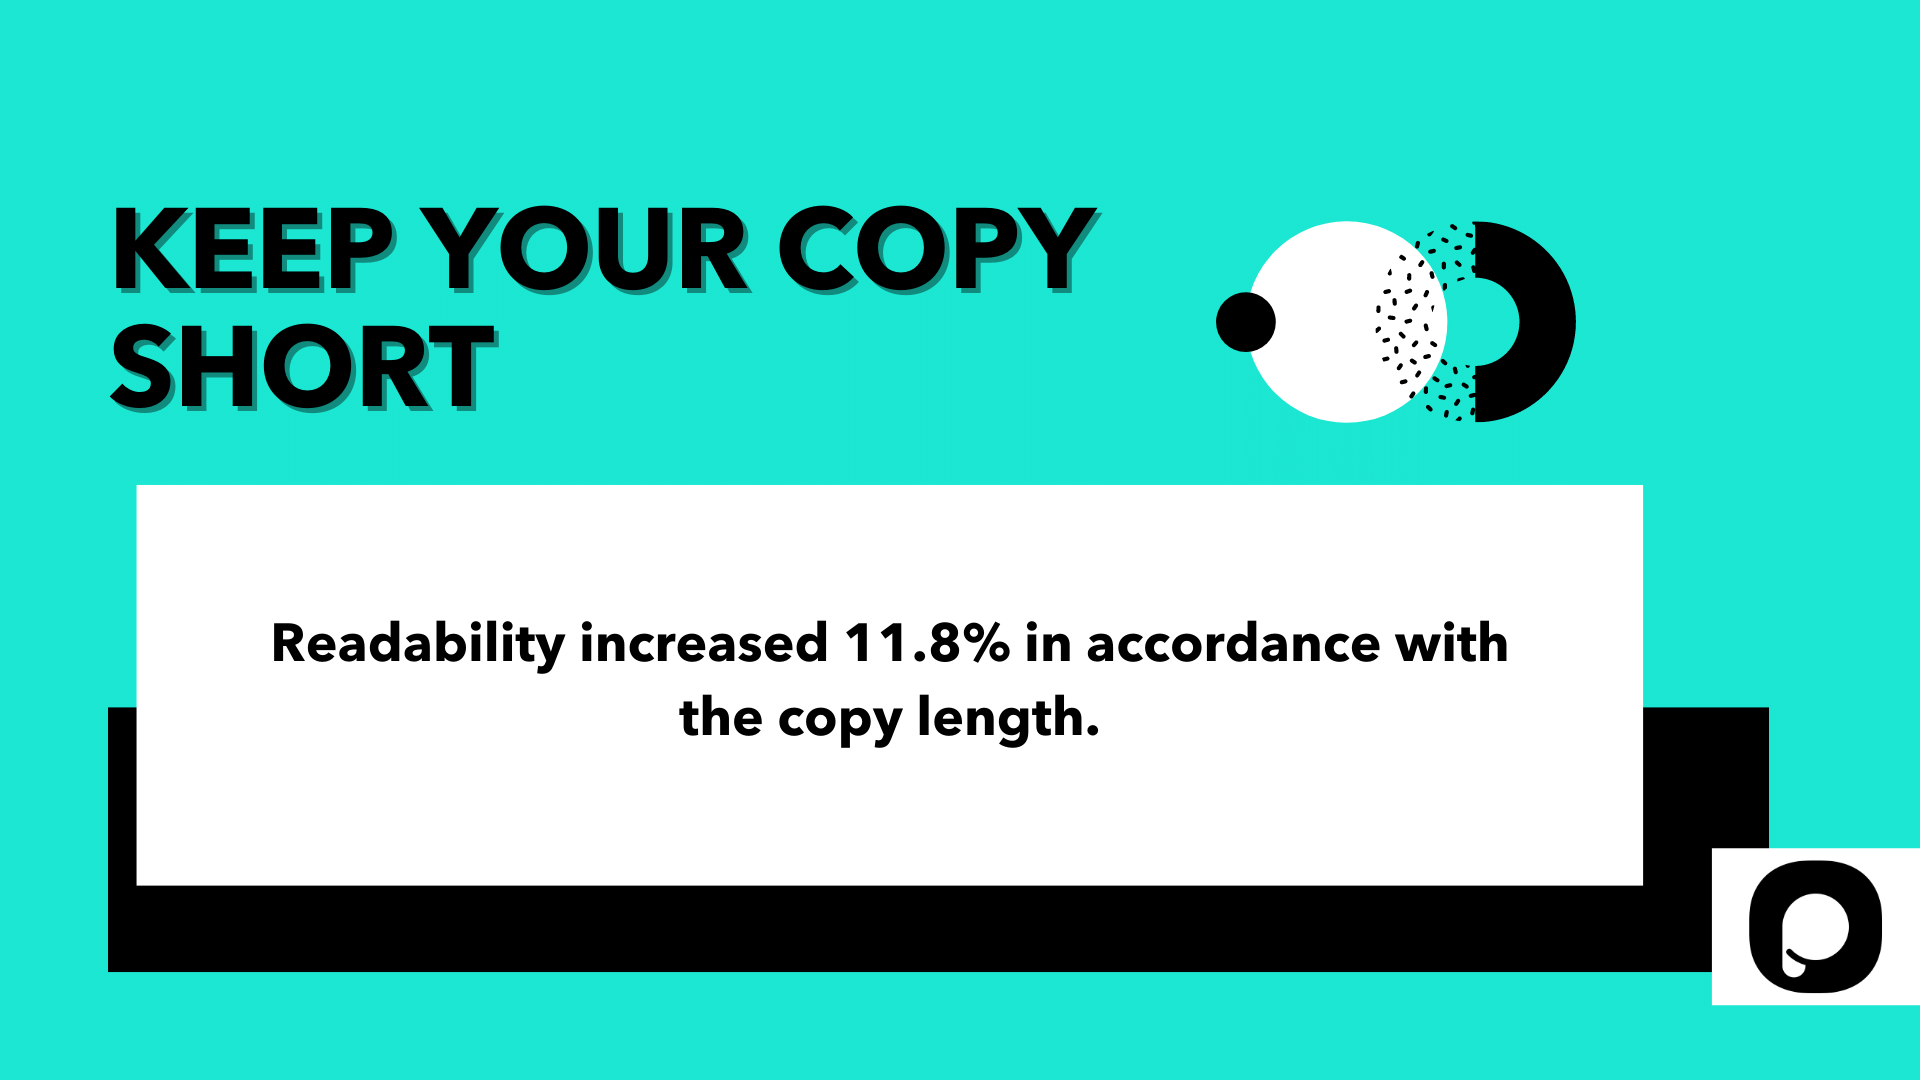
Readability increased 11.8% in correlation with optimized copy length, according to a benchmark study of over 34,000 landing pages. — Unbounce Conversion Benchmark Report (analysis of 34,000+ pages)
The 11.8% improvement measured reading ease scores, not conversion directly. But readability feeds conversion: visitors who understand your offer faster are more likely to act. The study found that SaaS pages could get away with more text (400-500 words) because the product requires explanation, while e-commerce pages performed better at 250-300 words.
Tip: Run your landing page copy through a Flesch Reading Ease test. Aim for a score above 60 (8th grade level). If your copy scores below 50, simplify sentence structure and cut jargon. For SaaS products, keep your above-the-fold copy under 100 words, then expand below for visitors who need more detail before committing.
How Do Emotions in Copy Influence Landing Page Conversions?
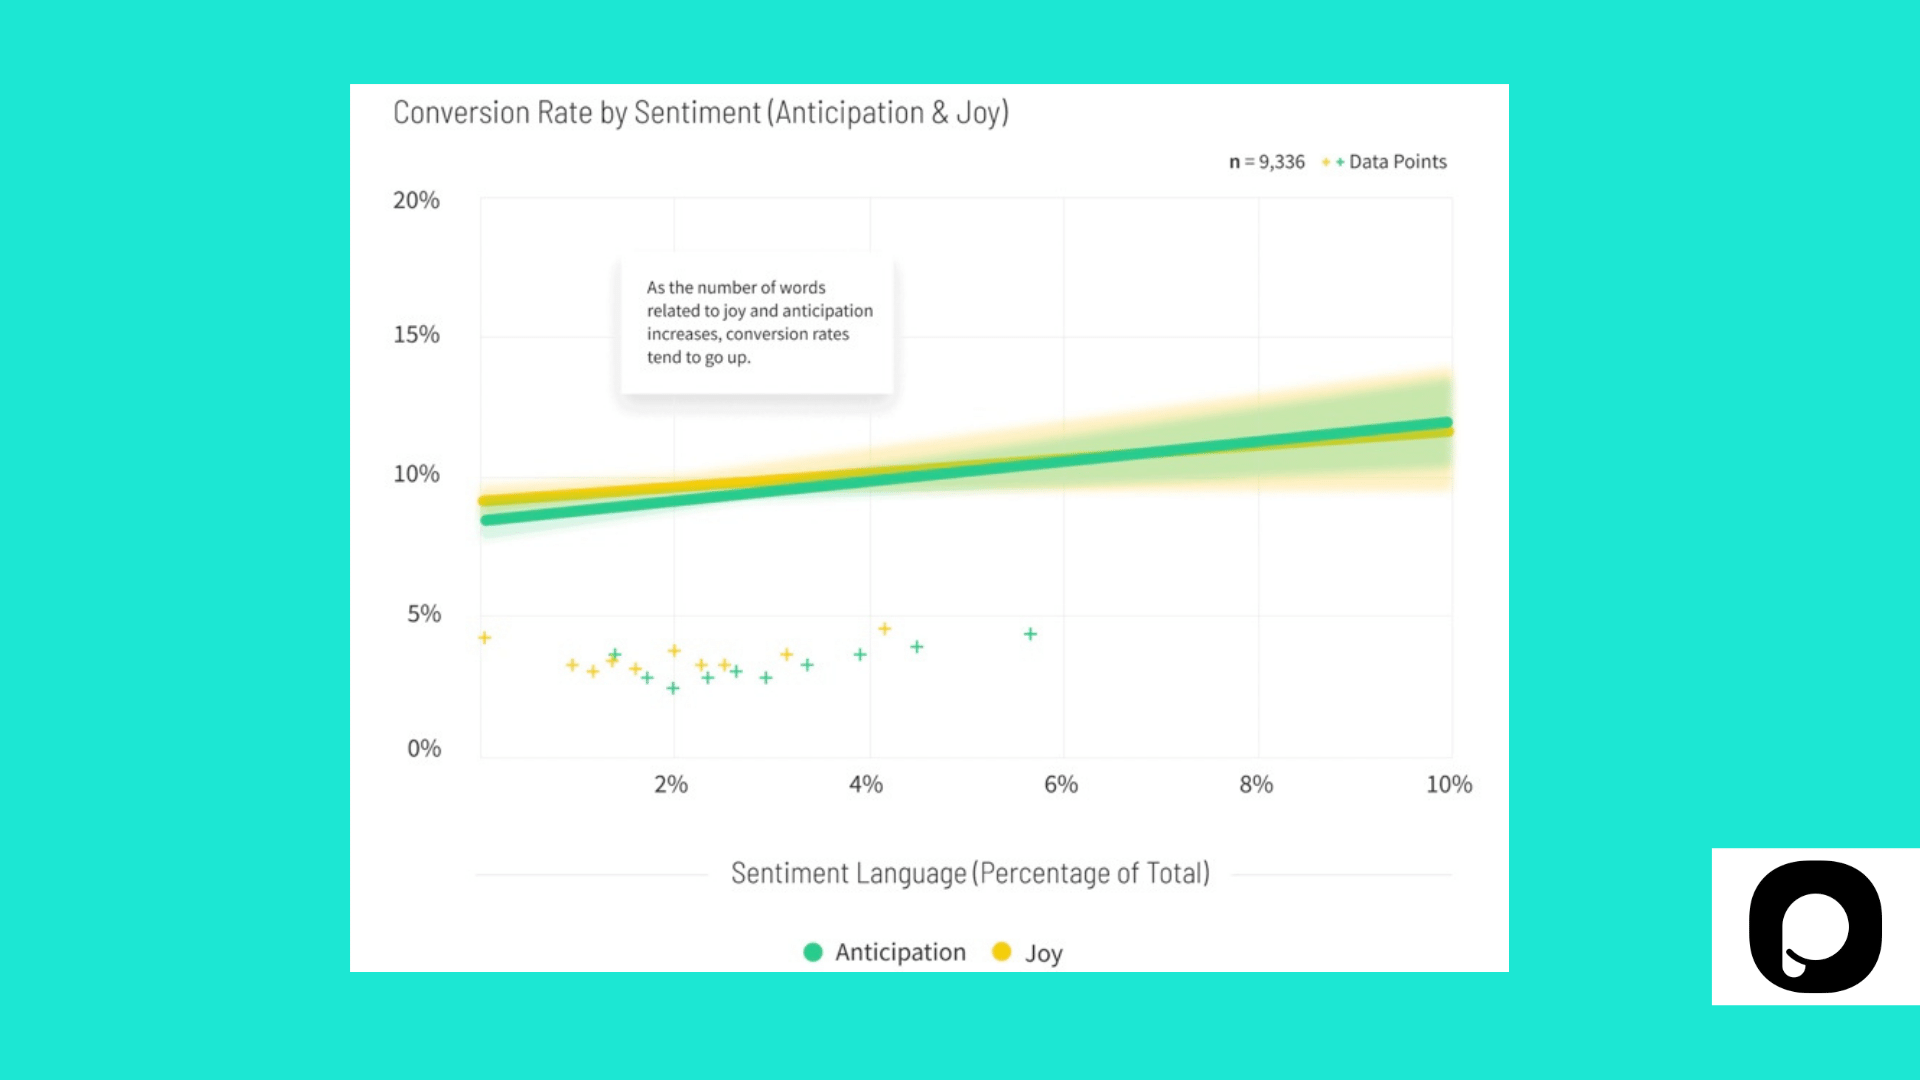
Emotional triggers in landing page copy affect conversion rates differently depending on industry. A benchmark analysis of thousands of landing pages found that joy and anticipation drive action in most verticals, with one notable exception.
Adding words that create anticipation and joy to landing page copy resulted in higher conversion rates across most industries. — Unbounce Conversion Benchmark Report
E-commerce landing pages showed the highest overall sentiment levels. They used more emotional words (both positive like "love" and "enjoy" and negative like "fear" and "miss out") compared to other industries. SaaS pages, by contrast, performed better with lower sentiment, relying on logic, specifics, and clarity over emotional appeal.
That doesn't mean SaaS pages should be dry. It means the emotional lever is different. SaaS buyers respond to confidence signals (case studies, ROI numbers, named customers) rather than urgency language. E-commerce buyers respond to scarcity and aspiration.
What to do: Audit your CTA and headline copy for emotional tone. For e-commerce, test adding urgency words ("limited," "only X left," "today only"). For SaaS, test replacing emotional language with specificity: swap "Transform your business" with "Reduce churn by 15% in 90 days." Track which version drives more form completions.
What Role Do Form Fields Play in Landing Page Conversions?
Form length is one of the most directly controllable conversion factors on any landing page. The data consistently shows that fewer fields means more completions, though the optimal number depends on lead quality requirements.
One company increased conversions by 120% by reducing their form from 11 fields down to 4. — Unbounce CRO research (form optimization case study)
The 120% lift is dramatic but predictable. Each additional form field introduces friction. By the time a visitor encounters field 7 or 8, abandonment rates spike. The four remaining fields in that case study were name, email, company, and phone, capturing enough data to qualify a lead without creating a survey-length experience.
What to do: Count the fields on your primary landing page form right now. If you have more than 5, ask which fields are genuinely required for your sales team to follow up. Move any "nice to have" fields to a post-conversion enrichment step. You can also test multi-step forms that break 6+ fields into 2-3 screens. Our form conversion rate guide covers this technique in depth.
According to HubSpot research, a landing page that did not ask for users' ages had a 40% higher conversion rate than the version that did. — HubSpot
Personal information like age, income, and location triggers privacy hesitation. Visitors feel exposed. The HubSpot test specifically isolated the age field and measured the impact: a single personal question cut conversions by nearly a third. The lesson is that the type of data you ask for matters as much as the quantity.
Tip: Eliminate any demographic or personal identification fields from your initial lead capture form. If you need demographic data for segmentation, collect it through progressive profiling after the visitor has already converted. Ask for business-relevant fields (company size, role, use case) rather than personal ones (age, gender, location). For Shopify stores, multi-step forms on Shopify split these into separate steps without overwhelming the visitor.
How Much Do Personalized CTAs Improve Conversions?
Personalized calls-to-action are among the highest-impact conversion optimization tactics available. The performance gap between a generic CTA and a personalized one is wider than most marketers expect.
Personalized CTAs outperform default versions by 202%
Research shows that personalized CTAs convert 202% better than default versions. — HubSpot
The 202% figure comes from HubSpot's analysis of over 330,000 CTAs across their platform. "Personalized" in this context means the CTA changed based on visitor attributes: returning vs. new visitor, lifecycle stage, device type, or referring source. A returning visitor might see "Continue where you left off" while a new visitor sees "Start your free trial."
What to do: Start with the simplest personalization: segment new vs. returning visitors. Show first-time visitors an introductory CTA ("See how it works") and returning visitors a progression CTA ("Start your free trial"). Tools like dynamic CTA builders can handle this without custom code. Once you've tested that split, expand to device-based or referral-source-based personalization.
Dynamic landing pages convert 25.2% more than static versions. — VWO
Dynamic pages go beyond CTA personalization. They adjust headlines, images, and even pricing displays based on the visitor's context. The 25.2% lift measured by VWO accounts for the compounding effect of multiple personalized elements working together. A visitor arriving from a Google ad for "CRM for real estate" sees a headline mentioning real estate, a testimonial from a real estate company, and a CTA referencing their industry.
What to do: If you're running paid campaigns, create dynamic text replacement rules that match your ad copy to your landing page headline. This alignment alone can improve Quality Score and reduce cost per click while boosting on-page conversion. For more on landing page optimization tools, we've reviewed the top options.
Why Does Mobile Optimization Matter for Landing Page Performance?
Mobile traffic dominates the web, but mobile conversion rates lag behind desktop. That gap represents both a problem and an opportunity for marketers willing to invest in mobile-specific optimization.
Up to 70% of web traffic comes from mobile devices. — TechJury (2025 data)
Seventy percent of your visitors are on phones. If your landing page was designed desktop-first and merely "responsive," you're likely leaving conversions on the table. Mobile users have different behaviors: they scroll faster, read less, and tap instead of click. Your page needs to be built for those behaviors, not just resized for them.
What to do: Test your landing page on an actual phone, not just a browser resize. Check that your CTA button is thumb-reachable (bottom third of screen), your form fields are large enough to tap without zooming, and your above-the-fold content loads in under 2 seconds. Google's mobile-first indexing means the mobile version of your page is the version that ranks. Read our digital marketing statistics roundup for more mobile benchmarks.
86% of the top-performing landing pages are mobile-friendly. — Nifty Marketing
That 86% isn't surprising in 2026, but the remaining 14% of top performers getting by without mobile optimization likely serve desktop-heavy B2B audiences. For everyone else, mobile-friendliness isn't optional. Google's mobile interstitial penalty (confirmed in the API leak as violatesMobileInterstitialPolicy) also means aggressive mobile popups can hurt your organic rankings.
What to do: Run Google's Mobile-Friendly Test on every landing page. Fix any flagged issues immediately. Then go beyond "friendly" to "optimized": reduce form fields on mobile, use click-to-call buttons for phone-heavy audiences, and consider mobile-specific CTAs that are shorter and more action-oriented. For popup-based lead capture that works within Google's mobile guidelines, popup software with mobile-safe templates handle the compliance requirements automatically.
How Does Page Speed Affect Landing Page Conversions?
Page speed has a direct, measurable impact on conversion rates. Every additional second of load time creates friction that pushes visitors toward the back button. The data on this relationship is unambiguous.
Google defines a good page load speed as 2-3 seconds, with Largest Contentful Paint (LCP) thresholds set at 2.5 seconds for "good" and 4 seconds for "poor." — Google Web Vitals Documentation
The 2.5-second LCP threshold is part of Google's Core Web Vitals framework. Sites that miss this threshold are at a measurable ranking disadvantage. According to the Content Warehouse API leak, mobileCwv and desktopCwv attributes feed directly into ranking calculations. Only 47-54% of websites currently pass all three Core Web Vitals metrics, which means meeting these thresholds puts you ahead of roughly half the web.
What to do: Run your landing page through Google PageSpeed Insights and note your LCP score. If it's above 2.5 seconds, the most common fixes are: compress and resize images (switch to WebP format), defer non-critical JavaScript, and use a CDN for static assets. For landing pages specifically, remove any third-party scripts that aren't directly contributing to conversion tracking. For a deeper look at conversion rate optimization, speed improvements are often the highest-ROI starting point.
What Is the Role of Social Proof on Landing Pages?
Social proof elements, particularly testimonials and reviews, function as trust signals that reduce the perceived risk of converting. The data shows that visitors look for external validation before taking action, and the format of that validation matters.
36% of the top-converting landing pages include testimonials from customers or clients. — Nifty Marketing
Only 36% of top converters use testimonials, which suggests that while social proof helps, it isn't the only driver. The other 64% may rely on strong value propositions, urgency elements, or product demonstrations instead. The takeaway: testimonials are a force multiplier, not a replacement for a clear offer. A weak offer with great testimonials still underperforms a strong offer with none.
If you don't have customer testimonials yet, use alternative social proof: user counts ("Join 15,000+ marketers"), press mentions, industry awards, or integration partner logos. Test the placement: above the fold near the CTA, below the fold as a scroll-stopping element, or both. A/B testing tools can measure which position drives more conversions for your specific audience.
What Are the Top Landing Page Design and Optimization Trends for 2026?
Landing page design is shifting toward AI-driven personalization, faster page creation workflows, and mobile-native layouts. The 2026 trends aren't theoretical predictions; they're already measurable in conversion data.
The biggest trends shaping landing page design in 2026 include AI-powered personalization, mobile-native layouts, and conversational lead capture. — Moburst (2026 Trends Report)
AI-powered personalization goes beyond dynamic text replacement. In 2026, landing page tools use machine learning to adjust layouts, images, and offers in real time based on visitor behavior patterns. A visitor who has viewed your pricing page three times sees a different page version than someone arriving for the first time from a blog post.
What to do: If you're not using any personalization yet, start with rule-based personalization (traffic source, device type, location). That doesn't require AI. Once you have enough traffic data (1,000+ monthly visitors to a single page), test AI-driven layout optimization through platforms that support multivariate testing.
The top 10% of landing pages receive almost 80% of traffic. — VWO, citing WordStream research
This Pareto-like distribution means a small number of pages drive most results. I've seen this pattern across dozens of B2B SaaS accounts: one or two landing pages generate 60-70% of all leads while the rest barely register. The practical implication is that optimizing your top 2-3 pages will yield more impact than creating 10 new ones.
Tip: Identify your top 3 landing pages by traffic volume. Commit to running an A/B test on each one every month for the next quarter. Test headlines first (biggest potential impact), then CTA copy, then form layout. Even a 10% improvement on a high-traffic page can equal the total output of several lower-traffic pages combined.
Landing pages convert 160% better than other signup methods like generic website pages or blog sidebars. — Sellers Commerce
The 160% advantage comes from focus. A landing page eliminates navigation, sidebar distractions, and competing CTAs. The visitor has one path forward: convert or leave. That constraint is a feature, not a bug. Blog posts, homepages, and category pages serve multiple purposes, but landing pages serve one.
What to do: Audit any campaign that's sending paid traffic to non-landing pages (homepages, blog posts, product pages). Build dedicated landing pages for each campaign with a single CTA and no top navigation. Our landing page conversion rate guide explains the benchmarks to aim for. Even a simple page with a headline, 3 bullet points, a testimonial, and a form will outperform a full website page for conversion.
How Does A/B Testing Improve Landing Page Results?
A/B testing remains the most reliable method for improving landing page performance, yet adoption remains surprisingly low. The data gap between teams that test and those that don't grows wider each year.
It took six rounds of tests to find a variation that performed 79.3% better than the original client page. — CXL Institute (case study)
The CXL case study is instructive because it took six rounds, not one. Most A/B tests don't produce a winner on the first try. The value compounds with iteration. Round one might give you a 5% lift, round two another 8%, and by round six, the cumulative effect is transformational. Teams that quit after one inconclusive test miss this compounding dynamic entirely.
Tip: Set a minimum commitment of 3 consecutive A/B tests per landing page before evaluating whether testing "works" for your pages. Run each test to statistical significance (typically 95% confidence), which usually requires 1,000+ conversions per variation. Start with high-impact elements: the headline (test value proposition angles), the CTA button (test copy, color, and placement), and the hero image (test product screenshot vs. lifestyle image vs. no image).
According to SEO Sherpa's 2026 analysis, emerging trends in landing page effectiveness include faster A/B testing cycles enabled by AI tools that can predict winning variations earlier, reducing the time and traffic needed for conclusive results.
For B2B SaaS teams running e-commerce conversion optimization, the same testing principles apply to product pages, cart flows, and checkout experiences. The methodology transfers directly.
What Can Real-World Case Studies Teach Us About Landing Pages?
Aggregate statistics tell you what's possible. Case studies show you how specific teams got there. These examples range from startups to enterprise brands, each illustrating a different optimization principle.
Later (social media scheduling platform) generated over 100,000 new leads using landing pages with an average conversion rate of 60%. — Later case study, reported by Unbounce
A 60% conversion rate sounds impossibly high until you look at the context. Later's landing pages offered free tools (link-in-bio builder, caption generator) where the "conversion" was creating a free account. The barrier to entry was nearly zero, and the value was immediate. This approach, known as product-led growth, turns the landing page into a product experience rather than a sales pitch.
Quick tip: Consider whether you can offer a free tool, template, or interactive element on your landing page instead of asking for contact information outright. Calculator tools, assessment quizzes, and instant-result generators consistently convert at 20-40% because the visitor gets value before giving their email.
From our analysis of hundreds of B2B SaaS landing pages at Popupsmart, we've found that pages combining a clear value proposition with a low-friction first step (free trial, interactive demo, assessment) outperform those that lead with a "request demo" form. The conversion rate difference typically falls between 2x and 4x, depending on the product category and price point.
For e-commerce conversion rate benchmarks, the case study patterns differ: product-focused landing pages work better than tool-based ones, with video demonstrations often outperforming static images.
How Do Videos Affect Landing Page Conversion Rates?
Video on landing pages can increase engagement, but the effect on conversion rates depends heavily on video type, length, and placement. Not every page benefits from video.
39% of marketers say including video on landing pages has positively impacted their conversion rates. — Sellers Commerce
That 39% is notably modest. It means 61% of marketers either saw no impact or didn't track the effect. Video works best when it answers a specific question the visitor has at the moment of conversion: "What does this product look like in action?" or "How will this solve my problem?" Background videos and brand storytelling videos rarely move the conversion needle.
If you add video to a landing page, keep it under 90 seconds, place it near (but not above) your primary CTA, and focus on showing the product or service in action rather than telling a brand story. Test the page with and without video. If the video version doesn't improve conversions within a statistically significant test, remove it. Page speed matters more than having video present.
How We Compiled Landing Page Statistics
We pulled these landing page statistics from 23 sources published between 2024 and 2026, including conversion benchmark reports from Unbounce (34,000+ page analysis), HubSpot's marketing data (330,000+ CTA analysis), and specialized CRO research from CXL Institute, VWO, and First Page Sage. Industry-specific benchmarks came from vertical analyses by Email Vendor Selection, Sellers Commerce, and Salesgenie.
Every statistic links to its source document. Where a secondary source cited primary research (for example, VWO citing WordStream data), we noted the original researcher. Conversion rate benchmarks vary significantly by geography, traffic source, and offer type, so treat the figures here as directional baselines rather than exact targets for your specific situation.
FAQ About Landing Page Statistics
What is the average landing page conversion rate by industry in 2026?
The median landing page conversion rate across all industries is 6.6% as of 2026, according to data compiled by Involve.me and corroborated by Genesys Growth. B2B SaaS pages average around 6.6% with top performers exceeding 10%, while e-commerce pages typically fall between 2.5-3.5%. Education leads at 5.8% median, and finance sits at 5.0%. These rates assume standard lead-gen or signup pages; product-led landing pages with free tools can see 20-60% conversion rates because the barrier to entry is lower.
What is a landing page conversion rate formula?
The formula is: (Number of Conversions / Total Page Visitors) x 100 = Conversion Rate %. If your landing page gets 2,000 visitors and 130 fill out the form, your conversion rate is (130 / 2,000) x 100 = 6.5%. Some teams calculate this using unique visitors rather than total sessions, which produces a slightly higher rate. The important thing is to use the same calculation method consistently so your comparisons are valid over time.
How many landing pages should a business have?
HubSpot's research shows that companies see a 55% lead increase when scaling from 10 to 15 landing pages, and businesses with 21-40 pages see up to 300% more conversions than those with fewer. But more pages only help if each one serves a distinct audience, offer, or campaign. A good starting point: one landing page per ad campaign, per major product or service, and per key buyer persona. Quality and relevance per page matter more than the raw count.
What are high-converting landing page examples?
High-converting pages share common traits: a single, focused CTA; a headline that matches the visitor's search intent or ad copy; social proof near the conversion point; and fast load times under 2.5 seconds. Later achieved a 60% conversion rate by offering free tools. CXL's case study documented a 79.3% improvement through six rounds of systematic A/B testing. The specifics vary by industry, but the pattern stays the same: match the offer to the audience, reduce friction, and test continuously.
How do sentiments affect landing page conversions?
According to Unbounce's benchmark report, emotional copy (words evoking anticipation and joy) lifts conversions in most industries, with e-commerce pages showing the highest sentiment levels. SaaS pages are the exception: they convert better with lower emotional language and more specificity (numbers, case studies, ROI data). The key is matching your emotional tone to your audience's buying mindset. B2B buyers making a considered purchase respond to confidence signals, while B2C impulse buyers respond to urgency and aspiration.

How would you rate your experience with this article? 😊