Cart Abandonment Statistics for 2026
Cart abandonment in 2026 remains ~70% globally (higher on mobile ~79% vs desktop ~67), driven mainly by unexpected extra costs (~48%). Fashion is highest (~85%), grocery lowest (~50%); recovery via emails ($3.65/RPR, 3.33% CVR) and UX/AI can reclaim 15–20%.
You are leaving a vast amount of money on the table. No jokes.
Cart abandonment is a major problem for all online retailers, regardless of how big a company is.
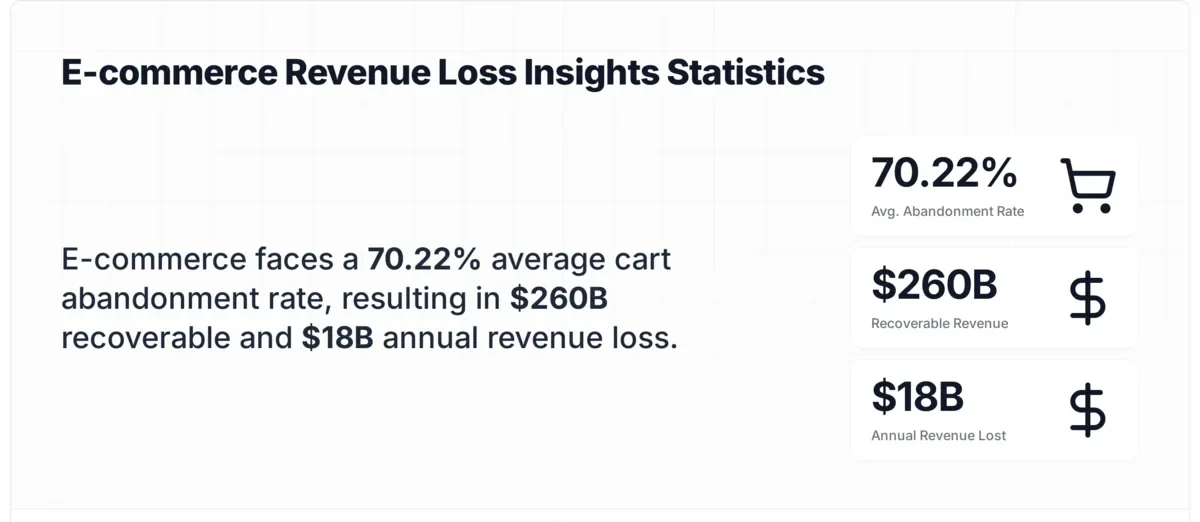
The average cart abandonment rate is 70.22% globally in 2026, according to Baymard Institute's meta-analysis of 50 studies. E-commerce businesses lose $18 billion in annual revenue from abandoned carts, while $260 billion remains recoverable in the US and EU. These 30+ cart abandonment statistics cover rates by device, industry, and region, plus recovery benchmarks.
Key Cart Abandonment Statistics for 2026
Before we break down each category, here are the headline numbers that define the state of cart abandonment right now.
• The global average cart abandonment rate is 70.22% based on 50 documented studies — Baymard Institute
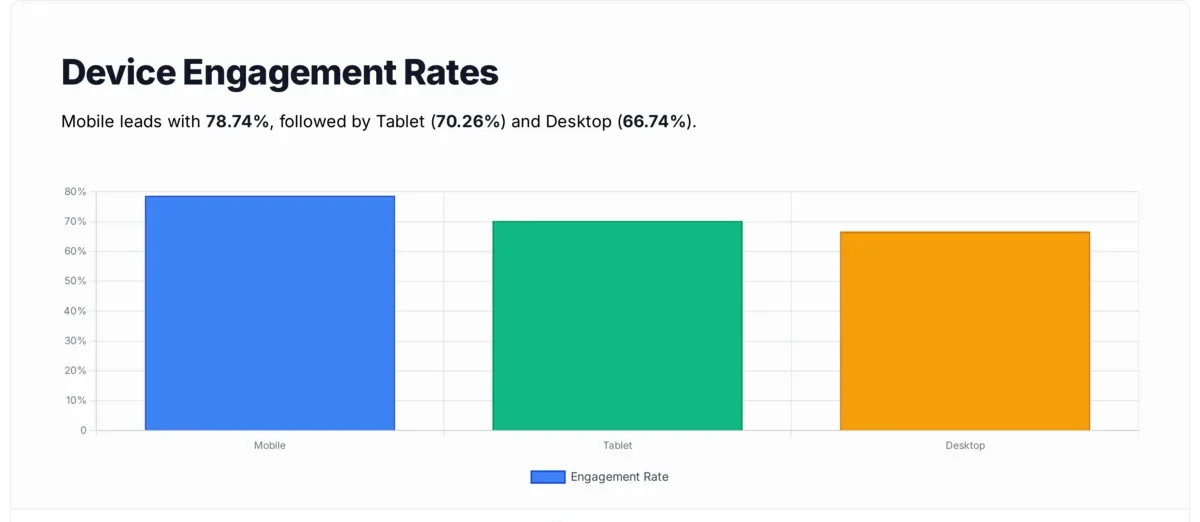
• Mobile devices see the highest abandonment at 78.74%, compared to 66.74% on desktop — Email Vendor Selection
• Extra costs (shipping, taxes, fees) drive 48% of all cart abandonments — Cropink
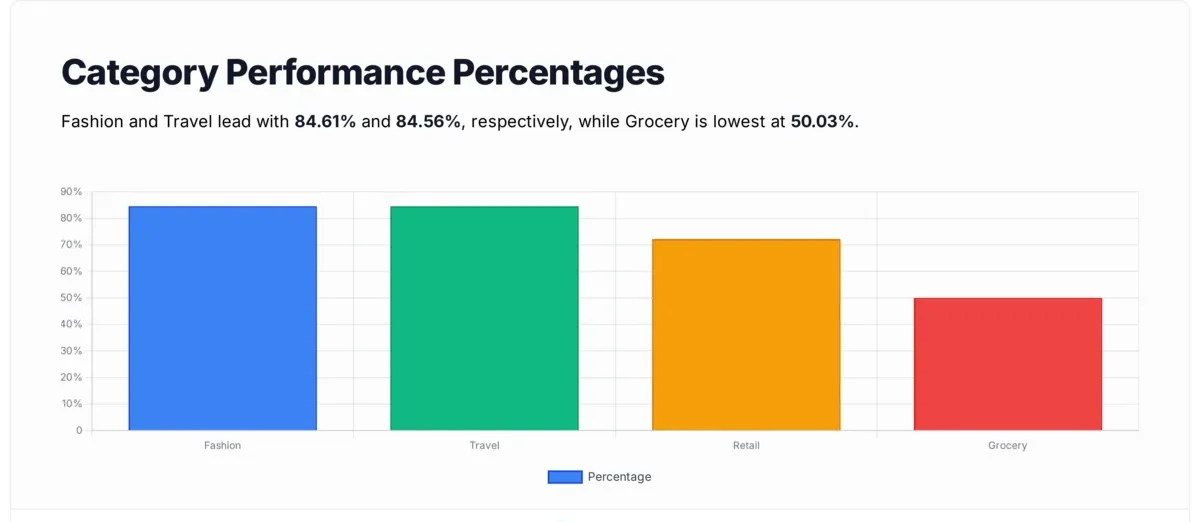
• Fashion leads industry abandonment at 84.61%, while grocery sits lowest at 50.03% — Email Vendor Selection
• E-commerce brands lose $18 billion in sales revenue each year from abandoned carts — Drip
• Abandoned cart email flows generate an average $3.65 revenue per recipient with a 3.33% conversion rate — Klaviyo
When we look at these numbers, the pattern is consistent: the global rate barely moves, but the gap between brands that actively recover carts and those that don't keeps widening. Let's look at each category in detail.
What Is the Global Cart Abandonment Rate in 2026?
The global cart abandonment rate has stabilized around 70% for nearly two decades, but the exact figure depends on which study you reference and how many data points it aggregates.
The average documented online shopping cart abandonment rate is 70.22%, based on 50 studies compiled by Baymard Institute. — Baymard Institute
This number hasn't shifted much since Baymard started tracking it. As GrowthSuite notes, the ~70% figure has stayed remarkably stable since 2006. Better technology hasn't fixed it because the root cause is buyer psychology, not broken checkout flows.
What to do: Stop treating 70% as a failure metric. It's a baseline. Your job isn't to eliminate abandonment; it's to recover the shoppers who had genuine purchase intent but hit friction. Focus on the 30-40% of abandoners who weren't "just browsing."
According to Dynamic Yield (Mastercard), the average shopping cart abandonment rate globally is 76.99%.
Dynamic Yield's number runs higher because their benchmark pulls from real-time e-commerce data across thousands of sites, capturing seasonal spikes that meta-analyses smooth out. The difference between Baymard's 70.22% and Dynamic Yield's 76.99% isn't a contradiction. It reflects different measurement windows and site samples.
Global cart abandonment headline stats for 2026
Cart abandonment rates have been climbing steadily since 2014, after reaching an all-time high in 2013. — Statista
Statista's longitudinal data shows an increase of more than 10 percentage points compared to rates recorded in the early 2010s. The upward trend correlates with the explosion of mobile shopping, which consistently shows higher abandonment than desktop.
If you're benchmarking against rates from 3-4 years ago, adjust upward. A 72% abandonment rate in 2026 is actually better than average, even though it would have been above average in 2018.
How Do Cart Abandonment Rates Differ by Device?
Device type is the single biggest predictor of whether a shopper completes checkout. Mobile consistently leads abandonment across every study I've reviewed, and the gap isn't closing.
Mobile devices have the highest shopping cart abandonment rate at 78.74%, tablets sit at 70.26%, and desktop users abandon at 66.74%. — Email Vendor Selection
That's a 12-point gap between mobile and desktop. When mobile accounts for 60-65% of all e-commerce traffic, this single stat explains why overall abandonment keeps rising. More traffic shifts to mobile each year, and mobile checkout friction remains harder to solve.
Quick tip: Audit your mobile checkout separately from desktop. Test it on a real phone (not just browser dev tools). Pay attention to form field sizes, keyboard types for each input, and thumb-reachable button placement. Small UX fixes on mobile yield disproportionate recovery.
Cart abandonment rates broken down by device type
According to RedStag Fulfillment, mobile abandonment reaches 80.2%, while desktop ranges between 70-73%.
RedStag's figures run slightly higher than Email Vendor Selection's, likely reflecting a different site mix. Either way, the directional finding is the same: mobile abandonment exceeds desktop by at least 7-12 percentage points across every credible source.
Tip: If you haven't implemented cart recovery popups optimized for mobile, you're missing your largest recovery opportunity. An exit-intent popup sized for mobile screens and triggered on back-button behavior can recapture shoppers before they leave.
Mobile abandonment accounts for roughly 70% of all lost carts, since mobile drives 60-65% of e-commerce traffic. — GrowthSuite
This is the stat that should shift your resource allocation. Seven out of ten abandoned carts happen on a phone. If your optimization budget is split evenly between desktop and mobile, it's misallocated.
What Are Cart Abandonment Rates by Industry?
Industry benchmarks matter because a "good" abandonment rate for travel looks nothing like a "good" rate for grocery. Comparing your rate to the global 70% average without industry context can mislead your optimization priorities.
Fashion leads all industries with an 84.61% cart abandonment rate, followed by travel at 84.56%, and retail at 72.23%. Grocery has the lowest rate at 50.03%. — Email Vendor Selection
Fashion's high rate makes sense: shoppers use carts as wishlists, comparing sizes, colors, and prices across tabs. Travel's rate reflects the complexity of booking (dates, passengers, seat selection) and the high price points that trigger comparison shopping.
Tip: Benchmark against your specific industry, not the global average. If you're in fashion and your abandonment rate is 80%, you're actually outperforming the industry by nearly 5 points.
Cart abandonment rates vary widely across industries
According to Firework, travel industry abandonment reaches 87.08%, while fashion sits at 84.41%.
Firework's data pushes travel even higher than fashion, which aligns with what we see in practice. Travel purchases involve more decision variables (dates, flexibility, insurance add-ons), and the average order value is significantly higher, which amplifies hesitation.
What to do: Travel and high-consideration industries should invest heavily in email remarketing sequences with flexible booking options and price-drop alerts. Fashion brands should focus on wishlist features and back-in-stock notifications.
The retail sector has a cart abandonment rate of 71.24%. — VWO
Retail sits closest to the global average, making it the best "control group" for benchmarking. If your retail store exceeds 75%, there's likely a specific UX or pricing friction you can isolate and fix.
What Are the Top Reasons for Cart Abandonment?
Understanding why people abandon matters more than knowing the rate. The reasons are well-documented and, critically, most of them are fixable.
48% of shoppers drop off due to unexpected costs at checkout, including shipping fees, taxes, and handling charges. — Cropink
This has been the number one abandonment driver for over a decade. It's not that shoppers can't afford shipping. It's that they feel deceived when the total jumps at checkout. The psychological response is disproportionate to the dollar amount.
Pro tip: Show estimated shipping costs on the product page or in the cart, not for the first time at checkout. If you offer free shipping above a threshold, display a progress bar: "Add $12 more for free shipping." This one change recovers more carts than any other single intervention I've seen in conversion rate optimization.
According to Salsify's 2026 Consumer Research report, 46% of shoppers abandon when the total price doesn't match their expectations. — Salsify
Salsify's finding reinforces the price transparency theme from a different angle. It's not just extra costs added at checkout. It's any gap between what the shopper expected to pay and what they actually see. This includes currency conversion surprises for international shoppers and tax calculations that vary by region.
According to, 55% of shoppers abandon carts due to unexpected fees, including shipping costs.
Dynamic Yield's figure is even higher at 55%, suggesting the problem may be getting worse as shoppers' expectations for transparent pricing increase. Amazon's consistent pricing display has trained consumers to expect no surprises at checkout.
What to do: Run an A/B test: show "Price includes shipping" on product pages versus your current display. Track cart-to-checkout conversion, not just overall conversion. The improvement usually shows up in that specific funnel step.
39% of shoppers abandon because extra costs (beyond the product price) are too high. — RedStag Fulfillment
This is related but distinct from the "unexpected" framing. Some shoppers see the costs, understand them, and still decide the total isn't worth it. The issue here is value perception, not transparency.
Tip: Offer tiered shipping (standard free, express paid) rather than a single paid option. When shoppers feel they have a choice, abandonment on cost drops. You can also use exit-intent popups to offer a small discount or free shipping to shoppers who are about to leave.
How Does Checkout UX Affect Cart Abandonment?
Beyond pricing, the checkout experience itself drives a significant share of abandonments. Friction in forms, account creation, and page load times all contribute.
A 35.26% potential conversion lift is available through checkout UX improvements alone. — RedStag Fulfillment (citing Baymard Institute 2025 research)
This is one of the most actionable stats here. Baymard calculated this by analyzing the gap between current average checkout UX quality and what's achievable with known best practices. A 35% lift doesn't require new technology. It requires fixing form labels, removing unnecessary fields, and adding progress indicators.
What to do: Audit your checkout against Baymard's UX guidelines. The highest-impact fixes: reduce form fields to the minimum required, enable autofill, add inline validation (don't wait until submission to show errors), and show a progress bar.
90% of shoppers will abandon their cart if the site is too slow. — Yottaa
Nine out of ten. That's not a gradual decline in conversion as load time increases. It's a cliff. Shoppers in 2026 have been trained by fast-loading apps and sites. A slow checkout page isn't just annoying; it triggers trust concerns ("Is this site legitimate? Is my payment safe?").
Tip: Test your checkout page load time on a real 4G mobile connection (not your office Wi-Fi). Target under 2.5 seconds for Largest Contentful Paint. Remove unnecessary third-party scripts from your checkout pages, and lazy-load everything that isn't above the fold.
Around 20% of people abandon their online shopping carts because they don't trust the website with their credit card information. — Baymard Institute
Trust abandonment is especially high for smaller or lesser-known brands. Shoppers from search ads or social media who land on a store they've never heard of are far more likely to bail at the payment step.
Pro tip: Add trust badges (SSL seal, payment provider logos, money-back guarantee) directly next to the credit card form, not buried in the footer. Display customer review counts near the checkout button. For Shopify stores specifically, check out our guide on Shopify cart abandonment emails that include trust-building elements.
How Effective Are Abandoned Cart Recovery Emails?
Email remains the highest-ROI channel for recovering abandoned carts. The numbers back this up across every study.
Abandoned cart email flows drive the highest average revenue per recipient ($3.65) and the highest conversion rate (3.33%) of all automated email flows. — Klaviyo
No other automated email comes close. Welcome sequences, browse abandonment, and post-purchase flows all trail behind abandoned cart emails in both RPR and conversion rate. The reason is obvious: these are shoppers who already demonstrated intent by adding items to their cart.
What to do: If you're running a single abandoned cart email, switch to a 3-email sequence. Send the first at 1 hour (simple reminder with product image), the second at 24 hours (add social proof like review counts or "X people bought this"), and the third at 72 hours (include a small incentive like free shipping or 10%). For subject line ideas, see our collection of 50+ abandoned cart subject lines.
68% of direct-to-consumer brands send at least one abandoned cart email. — Email Vendor Selection
That means 32% of DTC brands still don't send any recovery emails at all. If you're in that 32%, setting up a basic abandoned cart email is probably the single highest-impact thing you can do this quarter.
What to do: Don't overthink the first email. A plain-text-style email with the product name, image, price, and a direct "Complete your purchase" button outperforms heavily designed HTML emails in most tests. Get it live, then optimize.
Up to 20% of cart abandonments can be recovered and converted to sales. — Sendtric
Twenty percent recovery is the ceiling for best-in-class programs combining email, SMS, retargeting, and on-site recovery. Most brands recover 5-10%. The gap between average and best represents massive revenue opportunity.
Tip: Layer your recovery channels. Email handles the first 72 hours. Retargeting ads pick up the 3-14 day window. On-site abandoned cart recovery strategies (popups, saved carts, price-drop alerts) catch shoppers who return organically.
What Is the Financial Impact of Cart Abandonment?
The dollar figures put the percentage rates into business context. Cart abandonment isn't an abstract UX metric. It's a direct line item on your P&L.
E-commerce brands lose an estimated $18 billion in sales revenue each year because of cart abandonment. — Drip
$18 billion annually. That figure gets cited across dozens of sources and represents the total lost revenue across all e-commerce globally. For individual stores, you can estimate your own losses: multiply your monthly abandoned cart count by your average order value.
Tip: Calculate your store's specific abandonment cost. Pull your abandoned cart count from your analytics platform, multiply by AOV, then multiply by a conservative 10% recovery rate. That's the revenue you're leaving on the table each month without a recovery program.
$260 billion in recoverable revenue exists in the US and EU alone. — Envive
This number is staggering because it represents specifically the portion of abandonment that's fixable. Not the "just browsing" crowd, but shoppers who would have bought if the checkout experience had been better. The gap between $18 billion in annual losses and $260 billion in recoverable revenue shows how much cumulative opportunity exists.
What to do: Prioritize checkout UX improvements that target the top 3 abandonment reasons (extra costs, forced account creation, and complicated checkout). Even recovering 1% of that $260 billion opportunity means $2.6 billion across the market.
The average merchant recovers less than 15% of abandoned carts. — Unific
Less than 15% recovery means most merchants are spending significant budget acquiring customers via ads, only to lose them at the final step. Customer acquisition cost goes up when you can't close the sale. I've worked with e-commerce teams at Popupsmart where simply adding a well-timed exit popup at checkout pushed recovery from 8% to 14%, nearly doubling their rate without additional ad spend.
What Are the Historical Trends in Cart Abandonment?
Year-over-year data reveals whether the problem is getting better or worse, and helps predict where rates are heading.
Cart abandonment statistics for 2026 show that the global average has stabilized at 70.22%, representing a slight increase from 2023's 69.8% rate. — Koanthic
The 0.4 percentage point increase between 2023 and 2026 might seem small, but across billions of transactions, it represents millions of additional lost sales. The rate isn't improving despite advances in checkout technology, which suggests structural factors (mobile growth, increased comparison shopping) are offsetting UX improvements.
The Baymard Institute's earlier meta-analysis of 41 studies between 2006 and 2018 found an average cart abandonment rate of 69.57%. — Bolt
Compare that 69.57% (2006-2018 average) to today's 70.22%. Over 12+ years, the rate crept up less than one percentage point when measured as a long-term average. The stability confirms that abandonment is a behavioral constant, not a solvable technical problem.
In 2019, Black Friday saw global cart abandonment rates of 73.78%. On Cyber Monday just days later, the rate dropped to 68.94%. — Barilliance
This nearly 5-point swing between Black Friday and Cyber Monday illustrates how urgency and deal clarity affect abandonment. Cyber Monday's single-day framing creates urgency that Black Friday's extended sales period doesn't. Shoppers on Cyber Monday know the deal expires at midnight.
Tip: Apply Cyber Monday psychology year-round with time-limited offers. Countdown timers on cart pages and limited-stock indicators create the same urgency effect. Our popup conversion benchmark report shows that urgency-based popups convert 2-3x higher than static offers.
How Does Using Predictive AI Affect Cart Recovery?
AI and machine learning are entering the cart recovery space, and early data suggests meaningful impact.
Using predictive AI can cut cart abandonment by 18%. — ResultFirst
An 18% reduction through predictive AI primarily works by identifying at-risk shoppers before they abandon and intervening proactively. This includes personalized incentives triggered by behavior patterns (cursor movement toward the browser's close button, time spent on the checkout page, or cart value thresholds).
What to do: You don't need a custom AI model. Start with behavioral triggers: exit-intent detection, time-on-page thresholds, and cart value-based offers. These are available through popup builder tools like Popupsmart, without engineering resources. Once you've established baselines, explore predictive models that learn from your specific customer behavior.
Personalized retargeted ads can lead to an ROI of over 1,300%. — GrowthBadger
The 1,300% ROI comes from showing abandoners the exact products they left behind, not generic brand ads. Dynamic product retargeting pulls from the shopper's cart data to serve highly relevant ads across the web and social platforms.
Tip: Set up dynamic retargeting with your ad platform (Meta, Google Ads). Create a specific audience segment for cart abandoners with a 7-14 day window. Exclude purchasers from the audience daily to avoid annoying customers who already converted.
Retargeted ads send 26% of shoppers back to a site. — Invesp
26% return rate is strong, especially considering most display ads see click-through rates below 1%. Retargeting works because you're reaching people who already expressed interest. The targeting is pre-qualified by the shopper's own behavior.
What Are Regional Differences in Cart Abandonment?
Cart abandonment varies by geography, driven by differences in payment infrastructure, shipping expectations, and online shopping behavior patterns.
Globally, abandoned cart rates are at 76.8%, according to Mastercard Dynamic Yield benchmarks. — Sendtric (citing Mastercard Dynamic Yield)
This figure from Dynamic Yield's real-time benchmarks runs higher than Baymard's meta-analysis number because it captures live behavior across their merchant network, including seasonal peaks and regional variation.
APAC has the highest regional abandonment at 79.94%, followed by EMEA at 79.02%, and the Americas at 73.25%. — Dynamic Yield
APAC's high rate correlates with mobile-first shopping cultures in the region, where mobile commerce penetration exceeds desktop usage by wider margins than in North America. EMEA's rate reflects the fragmentation of payment methods across European countries, where shoppers may abandon if their preferred local payment option isn't available.
Tip: If you sell internationally, localize your checkout by region. Offer iDEAL in the Netherlands, Klarna in Scandinavia, PIX in Brazil, and UPI in India. Payment method availability alone can swing abandonment by 5-10 points in specific markets. Check your e-commerce conversion rate by country to identify where regional optimization will have the biggest payoff.
Sources & Key Takeaways of Cart Abandonment Statistics
Cart abandonment statistics were compiled from 16 distinct search queries across 51 sources, extracting 58 individual data points. Primary sources include Baymard Institute's ongoing meta-analysis (50 documented studies), Dynamic Yield's real-time merchant benchmarks (Mastercard), Statista's historical tracking data, Klaviyo's email performance database, and Barilliance's seasonal shopping analyses.
Where sources reported conflicting figures for the same metric, we presented both with context. Baymard's meta-analysis figure (70.22%) and Dynamic Yield's real-time benchmark (76.99%) measure the same thing differently, one aggregates published studies, the other tracks live merchant data. Both are valid for different use cases. All statistics link to their original source, were verified as of March 2026, and older data points are clearly labeled with their publication year.
Mobile shopping will keep growing, which means the 70% abandonment baseline is structural, it won't drop meaningfully anytime soon. What's changing is recovery sophistication. Behavioral triggers, predictive AI, and multi-channel sequences are helping well-optimized stores recover 15-20% of abandoned carts, up from the sub-10% average most merchants achieve today.
If there's one action to take from this data: calculate your own abandonment cost using your actual numbers, then build a recovery program targeting the specific reasons your customers leave. The stores that win fix the problems instead of just measuring them. If your checkout conversion rate is below your industry average, start by benchmarking against these statistics, then prioritize fixes with targeted cart abandonment popups and browse abandonment emails.
FAQ About Cart Abandonment Statistics
What percentage of carts are abandoned?
Approximately 70.22% of online shopping carts are abandoned globally, according to Baymard Institute's 2026 meta-analysis of 50 studies. The number varies by device (78.74% mobile vs. 66.74% desktop), by industry (84.61% fashion vs. 50.03% grocery), and by region (79.94% APAC vs. 73.25% Americas). For planning purposes, assume 7 out of every 10 carts on your store won't convert.
What is the success rate of abandoned cart emails?
Abandoned cart emails achieve an average 3.33% conversion rate and generate $3.65 revenue per recipient, according to Klaviyo's benchmarks. These are the highest-performing automated email flows across all categories. Multi-email sequences (3 emails over 72 hours) outperform single reminders. The first email should go out within 1 hour of abandonment for best results.
What is the main cause of cart abandonment?
Unexpected extra costs, including shipping fees, taxes, and handling charges, are the primary cause. Between 39% and 55% of abandoners cite extra costs as their reason, depending on the study. The fix is straightforward: show total estimated costs (including shipping) on the product page or in the cart, before the shopper reaches checkout. Price transparency alone recovers more carts than any discount strategy.
What is a good abandoned checkout rate?
A "good" rate depends entirely on your industry. For retail, anything below 70% is above average. For fashion, below 80% is strong. For grocery, below 50% is the benchmark. Rather than chasing an absolute number, focus on your trend line: are you improving quarter over quarter? A 2-3 point reduction per quarter through systematic checkout optimization is a realistic and meaningful target.
How can businesses reduce cart abandonment in 2026?
The highest-impact strategies in order of ROI: (1) display shipping costs before checkout, (2) enable guest checkout (forced account creation drives 26% of abandonments per Baymard), (3) set up a 3-email abandoned cart recovery sequence, (4) optimize mobile checkout UX, and (5) add trust signals (reviews, security badges, guarantees) to the payment page. Each of these targets a specific, documented abandonment driver.
What are cart abandonment trends by device?
Mobile abandonment (78-85% depending on source) consistently exceeds desktop (62-73%) by 10-15 percentage points. This gap has persisted for years and shows no sign of narrowing. Since mobile traffic now accounts for 60-65% of all e-commerce visits, mobile abandonment is the dominant driver of overall cart abandonment rates. Tablet falls in the middle at roughly 70%.

How would you rate your experience with this article? 😊