2026 Downtime Statistics That You Don't Want to Miss
Downtime is widespread and costly: 96% of IT leaders saw outages, with losses often $14k–$23.8k per minute and $300k+ per hour; manufacturing loses ~360 hours/year. Top causes are software, cyber, and network issues, and data loss is common (67.7%).
To control the downtime process and prepare, you should first learn the downtime statistics. Downtime statistics show that 96% of IT decision makers experienced at least one outage in the past three years, with costs reaching $14,000 per minute for midsize businesses and up to $23,750 per minute for enterprises. These 13 statistics cover outage frequency, financial impact, and production losses from the latest industry research.

Quick look at key findings on downtime:
• 96% of global IT decision makers experienced at least one outage in the past three years — LogicMonitor
• The average cost of downtime reaches $14,000 per minute for midsize businesses and $23,750 per minute for large enterprises — The Network Installers
• Manufacturing facilities lose 360 hours per year to unplanned downtime across 25 monthly incidents — MaintainX
• 83% of industry decision makers say unplanned downtime costs at least $10,000 per hour — ABB
• 67.7% of businesses experienced significant data loss in the past year — CrashPlan
What Is Downtime?
Downtime is any period when a system, website, application, or machine is unavailable to its users. It can be planned (scheduled maintenance windows) or unplanned (hardware failures, cyberattacks, software bugs). For businesses that depend on web-based services, even a few minutes of downtime can translate to lost revenue, damaged customer trust, and SEO penalties.
The distinction matters. Planned downtime gives your team control: you schedule maintenance during off-peak hours, notify users, and run updates with a rollback plan ready. Unplanned downtime hits without warning. A server crashes at 2 PM on a Tuesday, your checkout page goes dark, and customers leave for a competitor.
According to INTECH, planned downtime is ten times more cost-effective than unplanned incidents because you can contain the blast radius.
For IT teams, measuring downtime accurately is the first step toward reducing it. The standard metric is system availability, expressed as a percentage of total uptime over a given period. We'll break down those calculations later in this post.
Common Causes of Downtime in 2026
The root causes of downtime haven't changed dramatically over the past decade, but their relative impact has shifted. Software failures and cybersecurity threats now dominate, while hardware-related issues have dropped as cloud infrastructure has matured.
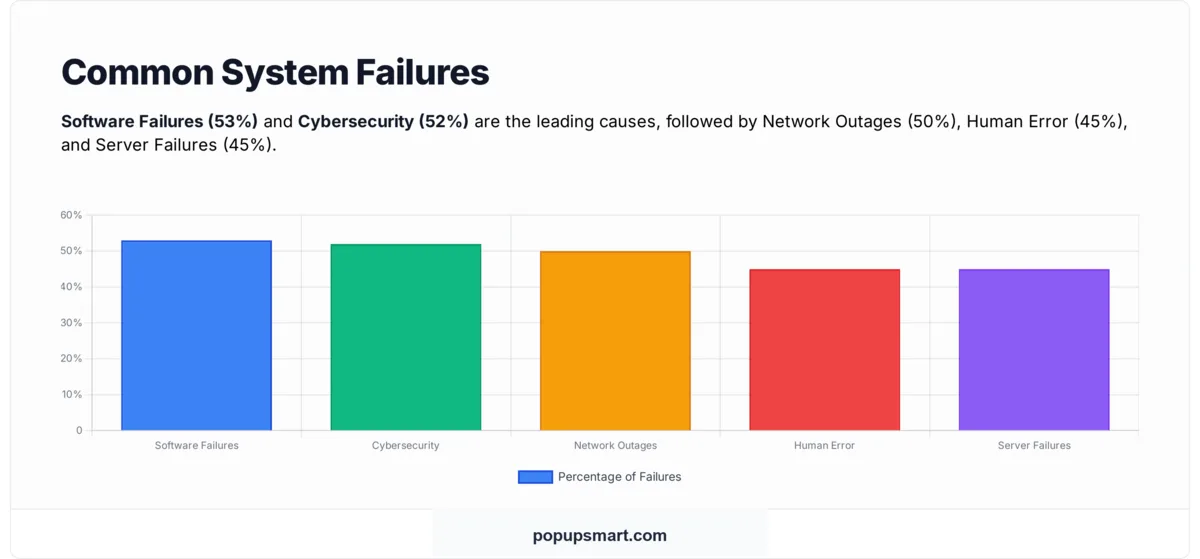
Software failures and cybersecurity incidents remain the leading causes of IT downtime in 2026.
Based on data from Integracon, the most common causes break down as follows:
| Cause | Percentage of Incidents |
|---|---|
| Software Failures | 53% |
| Cybersecurity Issues | 52% |
| Network Outages | 50% |
| Human Error | 45% |
| Server Failures | 45% |
| Storage Failures | 42% |
| Hardware Failures | 38% |
| Application Errors | 31% |
| Power Outages | 23% |
| Usage Surges | 13% |
| Natural Disasters | 10% |
| Third-Party/Cloud Outages | 10% |
Network outages account for 31% of all IT service outages, making them the single largest category of incidents. — The Network Installers
This stat is worth isolating because it challenges a common assumption. Many IT teams invest heavily in endpoint security and application monitoring but underinvest in network redundancy. If nearly a third of your outage risk comes from the network layer, that's where monitoring budgets should shift.
Tip: Audit your network architecture for single points of failure. If you're running one ISP connection, one DNS provider, or one load balancer without failover, you're carrying more risk than you need to. Redundant network paths cost less than a single hour of downtime.
Key Downtime Statistics for 2026
Outages aren't rare events that happen to other companies. The data shows they're close to universal, and the frequency is higher than most teams realize. These downtime statistics for 2026 paint a clear picture of how widespread the problem actually is.
Nearly all IT decision makers have dealt with outages, highlighting the universal nature of downtime risk.
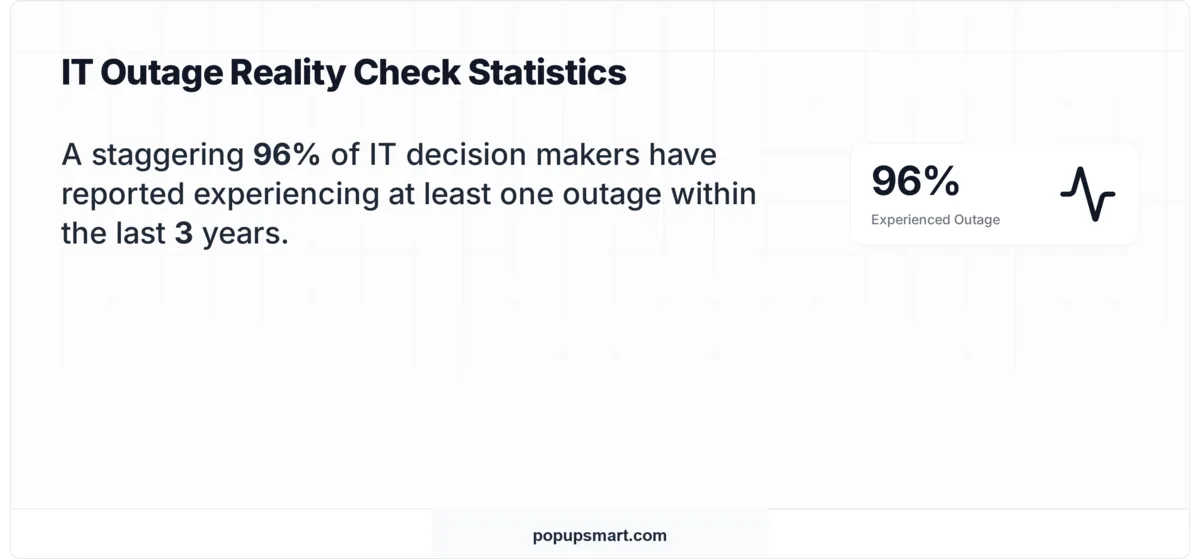
96% of IT Decision Makers Have Experienced an Outage
96% of global IT decision makers have experienced at least one outage in the past three years. — LogicMonitor
This isn't a question of "if" but "when." With 96 out of 100 IT leaders reporting outages, the remaining 4% likely just haven't detected theirs yet. The ubiquity of this figure signals that downtime is a structural feature of modern IT environments, not a failure unique to underfunded teams.
What to do: Shift from "preventing all downtime" (unrealistic) to "minimizing recovery time." Build incident response runbooks for your top 5 failure scenarios and run tabletop exercises quarterly so your team can restore service in minutes, not hours.
25 Unplanned Incidents Per Month in Manufacturing
The average manufacturing facility experiences 25 unplanned downtime incidents per month, adding up to 326 hours of downtime per year. — MaintainX
That's almost one incident per working day. For manufacturing operations where production lines run continuously, each interruption creates a cascade: idle workers, wasted materials, missed delivery windows, and overtime costs to catch up. The 326-hour annual total is equivalent to losing more than 40 full workdays.
Pro tip: Implement a CMMS (Computerized Maintenance Management System) to track failure patterns. When you can see that Machine 3 on Line B fails every 18 days, you can schedule preventive maintenance at day 15 instead of reacting after the breakdown.
44% of Leaders Face Monthly Equipment Interruptions
44% of leaders experience equipment-related interruptions at least monthly, with 14% reporting stoppages every single week. — ABB/Sapio Research
Weekly stoppages affecting 14% of businesses mean those organizations are losing productive capacity on a rolling basis. The gap between companies that experience weekly disruptions and those that don't often comes down to one factor: whether they've moved from reactive to predictive maintenance strategies.
If your team is dealing with weekly interruptions, prioritize an equipment audit. Identify the three assets with the highest failure frequency and evaluate whether sensor-based monitoring (vibration analysis, thermal imaging) can catch failures before they happen.
54% of Data Centre Operators Reported Significant Outages
54% of data centre operators reported a significant outage in the past three years. — StatusApp
Data centres are supposed to be the most resilient link in the infrastructure chain. That more than half of operators experienced significant outages in a three-year window undercuts the assumption that colocation or managed hosting eliminates downtime risk. Your provider's uptime SLA doesn't mean your application stays up.
What to do: Review your hosting provider's incident history (most publish status pages). If their track record shows recurring outages, evaluate multi-region deployment or a secondary provider for failover. Don't rely on a single data centre, regardless of its tier rating.
67.7% Experienced Significant Data Loss
67.7% of businesses experienced significant data loss in the past year. — CrashPlan
Downtime is temporary. Data loss can be permanent. When two-thirds of businesses report significant data loss within a single year, it points to a gap between how companies perceive their backup coverage and how well those backups actually work under pressure. Untested recovery procedures fail when you need them most.
Tip: Run a backup restoration test this month. Don't just verify that backups exist; actually restore a full dataset to a test environment and confirm it's complete and current. Many teams discover their backups are corrupted or weeks out of date only during an actual incident.
The Financial Impact of Downtime
The cost of downtime varies by company size, industry, and time of day, but every estimate lands in the same territory: it's expensive enough to justify almost any investment in prevention. These unplanned downtime statistics make the financial case clear.

The average cost of downtime per minute continues to rise, reaching $14,000+ for midsize businesses.
$14,000 Per Minute for Midsize, $23,750 for Enterprise
The average cost of downtime now exceeds $14,000 per minute for midsize businesses and can reach $23,750 per minute for large enterprises. — The Network Installers
At $14,000 per minute, a 30-minute outage costs a midsize company $420,000. For enterprises at the higher end, the same half-hour costs over $712,000. These aren't theoretical numbers pulled from edge cases. They reflect the combined impact of lost transactions, employee idle time, SLA penalties, and incident response labor.
Tip: Calculate your own cost per minute. Take your annual revenue, divide by the number of business minutes per year (roughly 525,600 for 24/7 operations), then add employee cost per minute and any contractual SLA penalties. That number is your downtime budget ceiling for monitoring and redundancy tools.
90%+ Report Costs Exceeding $300,000 Per Hour
Over 90% of midsize and large companies report downtime costs exceeding $300,000 per hour. — The Network Installers
When 9 out of 10 companies in this bracket cite six-figure hourly losses, it stops being a worst-case scenario and becomes the baseline expectation. The consistency of this figure across survey respondents suggests that companies aren't overestimating. If anything, many still undercount indirect costs like customer churn and brand damage.
What to do: Include indirect costs in your downtime impact assessment. Direct losses (revenue, SLA penalties) are easy to quantify. Add estimated customer lifetime value lost per incident, support ticket surge costs, and the marketing spend needed to recover brand trust.
83% Say Minimum $10,000/Hour, 76% Up to $500,000
83% of industry decision makers agree that unplanned downtime costs a minimum of $10,000 per hour, with 76% estimating an hourly cost of up to $500,000. — ABB
The wide range ($10,000 to $500,000) reflects the difference between a small production line stoppage and a full plant shutdown. What's notable is the floor: even at the low end, 83% of decision makers put the cost at $10,000+ per hour. No company considers downtime cheap.
What to do: Use this range to benchmark your own estimates. If your internal downtime cost calculation falls below $10,000/hour, you're likely missing cost categories. Revisit your calculation and include labor (idle workers still get paid), material waste, expedited shipping for delayed orders, and overtime to recover.
$100,000 to $540,000 Per Hour Range
The estimated cost of downtime ranges from $100,000 per hour to over $540,000 per hour. — Atlassian
Atlassian's range aligns with the ABB data but narrows the floor to $100,000 for organizations with significant digital operations. The difference between the low and high end often depends on when the outage hits. A Saturday morning incident at a B2B SaaS company costs far less than a Monday at 10 AM during peak usage.
Pro tip: Map your revenue by hour of day and day of week. Knowing your peak-revenue windows lets you schedule maintenance during low-impact periods and allocate your best on-call engineers during high-risk hours.
$7,900 Per Minute for Unplanned Data Centre Downtime
The average cost per minute of unplanned data centre downtime was $7,900. — StatusApp (citing IHS Markit)
At $7,900 per minute, a one-hour data centre outage costs $474,000. This figure is specific to data centre operations rather than the broader business impact, which makes it useful as a baseline for infrastructure teams calculating their own exposure. If your workloads run across multiple data centres, your per-minute cost may be lower due to redundancy.
If you're running critical workloads in a single data centre, this number should push you toward multi-region or hybrid cloud deployment. The monthly cost of a secondary region is typically a fraction of even one outage at this rate.
How Downtime Affects SEO and Traffic
Downtime doesn't just cost you revenue during the outage. It can hurt your search rankings for weeks afterward.
When Google's crawlers hit your site and get a 5xx error, they'll reduce crawl frequency and may temporarily drop pages from the index. If the outage lasts long enough, you can lose ranking positions that took months to earn.
According to Shopping Cart Elite, website downtime can affect SEO performance by up to 30%. That means a site ranking on page one for competitive keywords could slide to page two or three after a prolonged outage.
The mechanism is straightforward. Google values reliability as a quality signal. A site that returns errors during multiple crawl attempts looks unreliable. Beyond crawling, users who encounter a down page bounce immediately, sending negative engagement signals (what Google internally calls "bad clicks" via NavBoost) that further suppress rankings.
For e-commerce sites and SaaS platforms, the SEO damage compounds the direct revenue loss. You're not just losing sales during the outage. You're losing the organic traffic that would have brought future sales. If your site handles significant organic traffic, monitoring uptime isn't just an IT concern. It's an SEO priority and a core part of any conversion rate optimization strategy.
How Downtime Affects Production and Workforce
Beyond IT systems and websites, downtime statistics in the manufacturing sector reveal a different dimension of the problem: lost production hours and workforce disruption.
30 Hours of Production Loss Per Month
On average, facilities lose 30 hours of production per month to downtime, totaling 360 hours per year. — L2L
360 hours represents roughly 9 full work weeks of lost production annually. For manufacturers operating on thin margins, that volume of lost output can be the difference between a profitable year and a break-even one. The monthly cadence of 30 hours also suggests these aren't single catastrophic events but a steady drip of smaller disruptions.
What to do: Track downtime by category (equipment, material, labor, quality) and by shift. Patterns often emerge: if most downtime happens during the night shift, training or staffing gaps may be the root cause rather than equipment failure.
6 in 10 Leaders Report Disruptions Costing Over $250,000 Annually
6 in 10 leaders say these disruptions cost their businesses more than $250,000 annually. — L2L
When 60% of leaders report annual costs above a quarter-million dollars, it signals that downtime isn't a marginal expense. It's a line item that belongs in budget planning alongside raw materials, labor, and energy. The $250,000 floor also means many of these organizations are paying significantly more when indirect costs are included.
Tip: Add a "downtime cost" line to your annual budget. Treating it as a known expense rather than an unexpected one changes how leadership evaluates preventive investments. A $50,000 monitoring system looks different when you can show it against $250,000+ in annual downtime losses.
Calculating Downtime Percentages
Uptime is typically expressed as a percentage using the "nines" system. Each additional nine represents an order-of-magnitude improvement in availability, and the differences in allowed downtime are dramatic.
| Uptime Percentage | Allowed Downtime Per Year | Allowed Downtime Per Month |
|---|---|---|
| 99% ("two nines") | 3 days, 15 hours, 36 minutes | 7 hours, 18 minutes |
| 99.9% ("three nines") | 8 hours, 45 minutes, 57 seconds | 43 minutes, 50 seconds |
| 99.99% ("four nines") | 52 minutes, 35.7 seconds | 4 minutes, 23 seconds |
| 99.999% ("five nines") | 5 minutes, 15.4 seconds | 26.3 seconds |
The formula for calculating downtime percentage is:
Downtime % = (Total Downtime Minutes / Total Minutes in Period) x 100
To calculate uptime, flip it:
Uptime % = ((Total Minutes in Period - Downtime Minutes) / Total Minutes in Period) x 100
For example, if your service was down for 45 minutes in a 30-day month (43,200 total minutes):
Uptime = ((43,200 - 45) / 43,200) x 100 = 99.896%
That's below three nines. Depending on your SLA commitments, even 45 minutes could trigger penalty clauses. Most enterprise SaaS products target 99.9% or higher, which means your total allowed downtime for the entire month is under 44 minutes.
The practical takeaway: moving from 99.9% to 99.99% uptime doesn't sound like much, but it means cutting your allowed downtime from 8 hours and 46 minutes per year to under 53 minutes. That jump typically requires redundant infrastructure, automated failover, and continuous monitoring, all of which carry real costs.
Business Preparedness for Downtime
Most organizations know downtime is expensive. Far fewer are actually prepared when it happens. The gap between awareness and readiness is where the real risk lives.
According to BusinessWire, 70% of organizations lack full awareness of when their assets are due for maintenance. That's a preparedness failure at the most basic level. You can't prevent failures in equipment you aren't tracking.
The preparedness gap extends beyond manufacturing. According to Infrascale, 19% of B2B businesses don't recognize their own unpreparedness for downtime. Among those who do acknowledge the gap, the reasons cluster around a few themes:
| Reason for Unpreparedness | Percentage |
|---|---|
| Lacking knowledge of the downtime cost | 38% |
| IT team not ready | 28% |
| Not expecting the risk of downtime | 28% |
| Limited time to find solutions | 13% |
The top reason, "lacking knowledge of the downtime cost," circles back to the financial data earlier in this post. When leadership doesn't know that downtime costs $14,000+ per minute, it's hard to justify the budget for prevention. Knowing the number changes the conversation from "we can't afford monitoring tools" to "we can't afford not to have them."
Strategies to Minimize Downtime
Reducing downtime isn't a single initiative. It's a combination of infrastructure decisions, monitoring practices, and team readiness that work together. Based on the patterns in the data above, here are the actions with the highest impact.
1. Build redundancy into your critical path. If a single server, network connection, or data centre going down takes your service offline, you have a single point of failure. Multi-region deployment, redundant ISP connections, and database replicas are table stakes for any system where downtime costs exceed $10,000/hour.
2. Monitor proactively, not reactively. The difference between 25 monthly incidents and 5 monthly incidents often comes down to whether your monitoring catches degraded performance before it becomes a full outage. Set up alerts for CPU spikes, memory pressure, disk I/O, and response time thresholds. Finding problems at 80% capacity is cheaper than fixing them at 100%.
3. Test your backups. CrashPlan's data showing 67.7% of businesses experienced significant data loss tells you that having backups isn't enough. You need to verify they work. Schedule monthly restoration tests and document the time-to-recovery for each system.
4. Create and rehearse incident runbooks. When an outage hits, response speed depends on whether your team knows exactly what to do or is figuring it out in real time. Write step-by-step runbooks for your top failure scenarios (database crash, DNS failure, DDoS attack, certificate expiry) and run drills quarterly.
5. Invest in preventive maintenance. For physical infrastructure and manufacturing, the data is clear: reactive maintenance costs 10x more than planned maintenance. Track asset health metrics, schedule maintenance windows before failures occur, and use condition-based monitoring where sensor data is available.
6. Protect your SEO alongside your uptime. If your website goes down, configure your server to return a 503 status code with a Retry-After header rather than a 404 or 500. A 503 tells search engines the outage is temporary, and they'll revisit soon. A 404 signals the page is gone, and you may lose your indexed position. For e-commerce sites where organic search drives significant revenue, uptime monitoring is part of your inbound marketing infrastructure.
How I Gathered Downtime Statistics
This compilation draws from 13 verified statistics published between 2023 and 2026 across IT infrastructure, manufacturing, and data centre operations. Sources include LogicMonitor's IT Outage Impact Survey (300 global IT leaders), ABB's industrial downtime report conducted with Sapio Research (3,600 decision makers across 23 countries), MaintainX's maintenance statistics analysis, L2L's manufacturing downtime report, Atlassian's incident management cost benchmarks, CrashPlan's data loss statistics guide, and StatusApp's website downtime data (citing the IHS Markit data centre study).
I prioritized primary research and survey data over secondary citations. When a statistic appeared in multiple secondary sources, I traced it back to the original publisher and linked there directly. Cost figures are reported in USD. Manufacturing downtime statistics reflect global averages unless a geographic scope is specified by the source.
Concluding Downtime Statistics
Downtime costs more than most businesses budget for, happens more often than most teams expect, and takes longer to recover from than most incident plans anticipate. The $14,000-per-minute figure for midsize companies isn't an outlier. It's the midpoint of a range where 90% of companies report six-figure hourly losses.
The gap between companies that treat downtime as an occasional nuisance and those that treat it as a measurable business risk shows up in the data. Organizations with documented runbooks, tested backups, and redundant infrastructure don't avoid outages entirely. They recover faster. And in a market where 96% of IT leaders have dealt with outages in the past three years, recovery speed is the real differentiator.
Start with one action from this post. Calculate your per-minute downtime cost, test your backup recovery process, or audit your network for single points of failure. Any one of those moves you from awareness to preparedness, and that's where the financial protection begins.
FAQ About Downtime Statistics
How much downtime is 99.9% uptime?
99.9% uptime allows approximately 8 hours, 45 minutes, and 57 seconds of downtime per year, or about 43 minutes and 50 seconds per month. This is the "three nines" standard, and it's the most common SLA target for business SaaS applications. In practice, 99.9% means your service can go down for roughly 10 minutes per week and still meet the threshold.
How much downtime is 99.999% a year?
99.999% uptime, known as "five nines," permits only 5 minutes and 15.4 seconds of total downtime per year. That's about 26 seconds per month. Achieving five nines requires fully redundant systems with automated failover, geographic distribution, and zero-downtime deployment practices. Very few services outside critical infrastructure (financial systems, emergency services) operate at this level.
How much downtime is 99.99% in a year?
99.99% uptime allows 52 minutes and 35.7 seconds of downtime per year, or approximately 4 minutes and 23 seconds per month. This "four nines" standard is the target for high-availability enterprise services and major cloud platforms. Reaching it typically requires load-balanced, multi-region architecture with automated health checks and failover.
How to calculate downtime percentage?
Divide your total downtime minutes by the total minutes in the measurement period, then multiply by 100. For a monthly calculation: Downtime % = (Downtime Minutes / 43,200) x 100. For annual: Downtime % = (Downtime Minutes / 525,600) x 100. If your site was down for 2 hours (120 minutes) in a month, your downtime percentage is 0.278%, giving you 99.722% uptime.
What is the average cost of downtime in 2026?
The average cost of downtime in 2026 ranges from $14,000 per minute for midsize businesses to $23,750 per minute for large enterprises, according to The Network Installers. On an hourly basis, over 90% of midsize and large companies report costs exceeding $300,000. The wide range reflects differences in company size, industry, and whether the outage hits during peak or off-peak hours.
What are the main causes of downtime?
The three leading causes of downtime are software failures (53% of incidents), cybersecurity issues (52%), and network outages (50%), based on Integracon's analysis. Human error (45%) and server failures (45%) round out the top five. Network outages specifically account for 31% of IT service incidents according to The Network Installers, making network layer redundancy one of the highest-ROI investments for uptime improvement.

How would you rate your experience with this article? 😊