Shopify Conversion Rate Statistics 2026 & Key Insights
Shopify grew from a founders’ need into a massive e-commerce ecosystem (6.5M+ sites, ~2.7M stores), generating ~$292B GMV in 2024 and $8.88B revenue. 2025 benchmarks show ~1.4–1.8% average conversion (mobile ~1.2%, desktop ~1.9%), with Shop Pay, mobile UX, and CRO tactics driving top performers (3%+).
Shopify has one of my favorite origin stories, a small team trying to sell snowboards online in 2006 ends up building one of the biggest e-commerce platforms in the world.
It’s a good reminder that many great businesses start from a simple moment of frustration.
The average Shopify conversion rate sits at 1.4% across all stores in 2026, while top performers convert at 3.2% or higher. Desktop outpaces mobile by nearly 60% (1.9% vs. 1.2%), and industry averages range from 1.5% in food and beverage to under 1% in luxury goods. These Shopify conversion rate statistics cover benchmarks, device splits, industry breakdowns, and proven optimization tactics from 15+ verified sources.
Quick glance at key findings:
• The average Shopify store converts 1.4% of visitors into buyers, with the top 20% hitting 3.2% or above — Red Stag Fulfillment
• Desktop conversion rates average 1.9% compared to 1.2% on mobile, a gap that widens during checkout — Uptek
• Shopify processed $378.4 billion in GMV during 2025, a 29% jump from $292.3 billion in 2024 — TechnologyChecker
• Shop Pay usage surged 58% year-over-year during BFCM 2024, helping merchants hit $11.5 billion in weekend sales — Shopify
• The global e-commerce conversion average is 1.6% as of Q3 2025, making a 2%+ Shopify rate genuinely strong — Shopify Blog
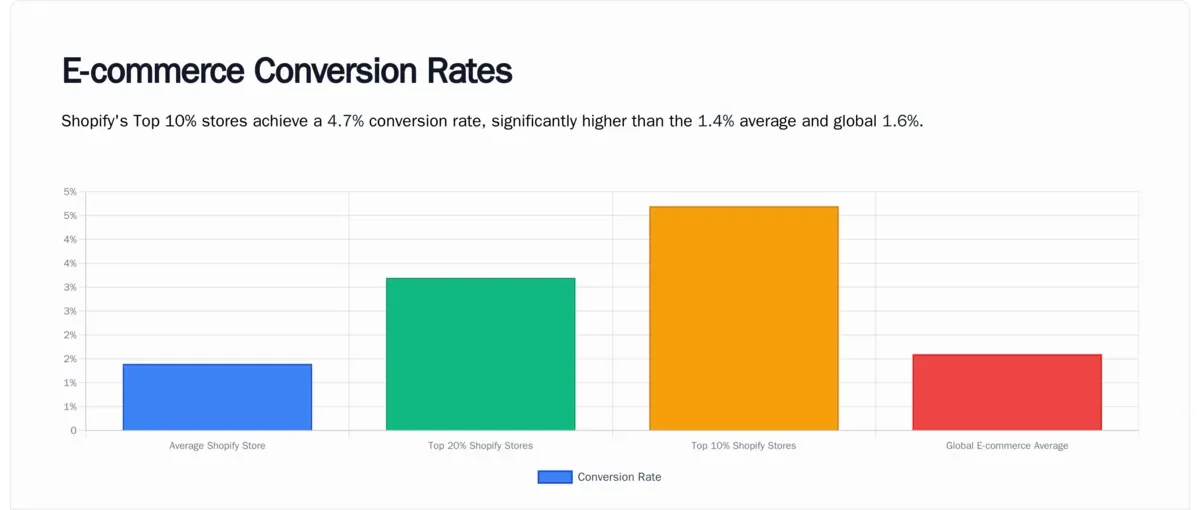
• Stores in the top 10% convert at 4.7% or higher, more than triple the platform average — Craftberry
What Is a Good Conversion Rate on Shopify?
A good Shopify conversion rate falls between 1.4% and 3.2%, depending on your niche, traffic quality, and price point. Anything above 2% puts you ahead of the platform median, and crossing 3.2% lands you in the top 20% of all Shopify stores.
I've examined hundreds of Shopify stores through Popupsmart over the past five years, and the single biggest predictor of conversion rate isn't design or product quality. It's traffic intent. A store pulling 80% of visits from paid social will almost always convert lower than one getting organic search traffic from buyers ready to purchase.
Here's how the tiers break down based on current data:
| Performance Tier | Conversion Rate | What It Means |
|---|---|---|
| Below average | Under 0.5% | Fundamental issues: traffic quality, product-market fit, or technical problems |
| Average | 1.4% – 1.8% | Typical Shopify store performance across all industries |
| Good | 2.0% – 3.1% | Above median; likely investing in CRO and traffic quality |
| Top 20% | 3.2%+ | Strong UX, optimized checkout, targeted traffic sources |
| Top 10% | 4.7%+ | Elite performance; typically high-intent niches or repeat-purchase categories |
According to Red Stag Fulfillment, the typical Shopify store converts between 1.4% and 1.8% of visitors into customers.
That range has held steady since 2024. What's changed is the ceiling. Stores investing in checkout optimization, personalized popups, and mobile UX are pushing past 3.2% more consistently than a year ago.
Tip: Check your Shopify analytics dashboard right now. If you're below 1.4%, focus on traffic quality first (are you attracting buyers or browsers?). Between 1.4% and 2%, start with checkout and mobile optimization to increase Shopify conversions. Above 2%, you're in a position where small wins compound fast.
Shopify Conversion Rate Benchmarks 2026
How Do Mobile and Desktop Shopify Conversion Rates Compare?
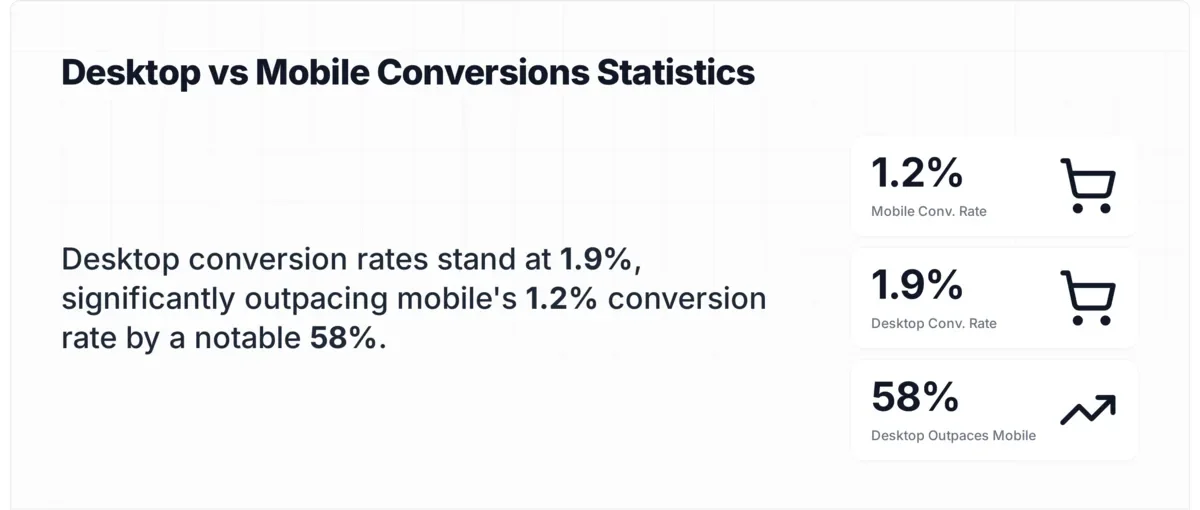
Mobile Shopify stores convert at roughly 1.2% on average, while desktop sits at 1.9%. That 58% gap matters because over 70% of Shopify traffic now comes from mobile devices, according to Yotpo.
According to Uptek, the average mobile conversion rate for Shopify stores is 1.2%, while desktop averages 1.9%.
The math here is brutal. If 75% of your 100,000 monthly visitors arrive on mobile and convert at 1.2%, that's 900 orders. The 25,000 desktop visitors converting at 1.9% generate 475 orders. Improving mobile conversion by just 0.3 percentage points would add 225 orders per month without spending a dollar on additional traffic.
What to do: Run your store through Google's PageSpeed Insights on mobile. If your Largest Contentful Paint exceeds 2.5 seconds, that's your first fix. After speed, simplify your mobile checkout: remove unnecessary form fields, enable autofill for shipping addresses, and make sure your primary CTA button is reachable with a thumb.
The top 20% of Shopify stores achieve a 2.8% mobile conversion rate, according to Ecommercetrix. That's more than double the average, and most of the gap comes down to page speed and checkout friction, not product selection.
Mobile vs Desktop Conversion Rates
What Are Shopify Conversion Rates by Industry?
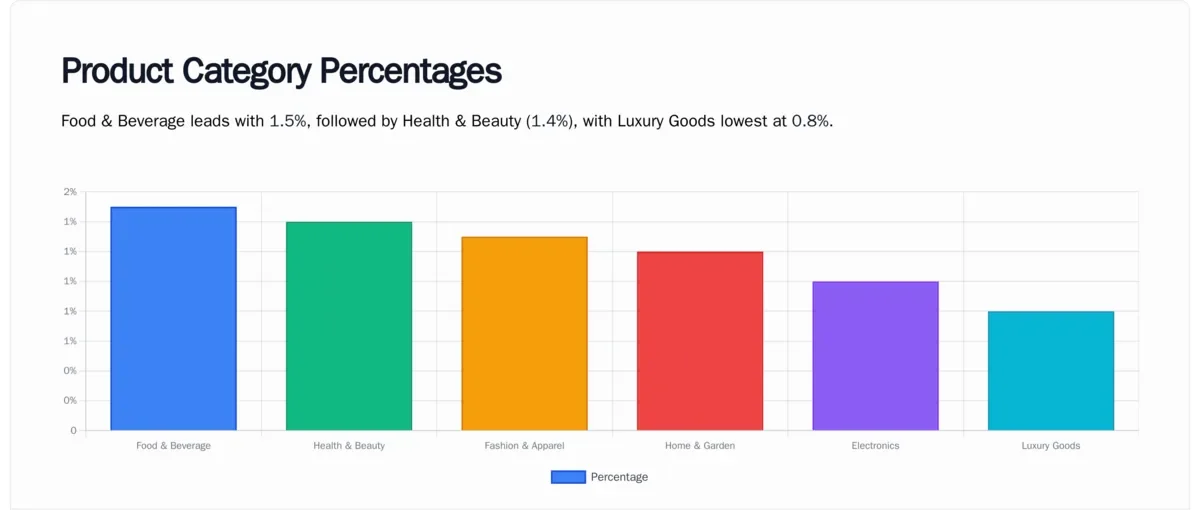
Conversion rates on Shopify vary dramatically by industry. Food and beverage stores can see rates above 6%, while luxury fashion may struggle to crack 1%. The difference comes down to purchase frequency, price points, and buyer consideration cycles.
According to Shopify's own benchmark data, food and beverage e-commerce converts at 6.22%, while multi-brand retail averages 3.93%.
These are broader e-commerce figures, not Shopify-exclusive. On the Shopify platform specifically, Blend Commerce reports that fashion and retail categories convert around 1.6% to 1.9%.
| Industry | Avg. Conversion Rate | Source |
|---|---|---|
| Food and beverage | 6.22% | Shopify Blog |
| Multi-brand retail | 3.93% | Shopify Blog |
| Fashion and apparel (broader market) | 2.9% – 3.3% | Sobot |
| Fashion and retail (Shopify-specific) | 1.6% – 1.9% | Blend Commerce |
| Health and beauty | 2.0% – 2.8% | IRP Commerce |
| Electronics | 1.5% – 2.2% | Speed Commerce |
| All ecommerce (global average) | 1.89% | IRP Commerce |
The gap between broader e-commerce and Shopify-specific rates is real, and it largely reflects Shopify's audience mix. Many Shopify merchants are newer, smaller stores still figuring out their traffic and product-market fit. Established stores on Shopify Plus routinely hit industry averages or exceed them.
Tip: Don't benchmark against the universal Shopify average of 1.4%. Find your industry's range in the table above and compare against that. If you're a food brand converting at 2%, you're actually underperforming your category even though you beat the Shopify-wide average.
Shopify Conversion Rates by Industry
What Does Shopify's Platform Growth Tell Us About Conversion Potential?
Shopify's growth numbers matter for conversion rate context because a larger merchant base means more benchmarking data, and the platform's infrastructure investments directly affect store performance.
According to TechnologyChecker, Shopify processed $378.4 billion in gross merchandise volume during 2025, up 29% from $292.3 billion in 2024.
That acceleration isn't just more merchants joining. Existing stores are selling more per visitor. Shopify's checkout improvements, Shop Pay expansion, and built-in conversion tools are lifting the floor for all merchants.
Other platform-level numbers that affect your store's conversion context:
• 2,846,464 live stores operate on Shopify as of Q1 2026, according to TechnologyChecker
• Over $1.1 trillion in cumulative sales have been processed across the platform's history, per Shopify's official reporting
• Shopify's Q2 2025 revenue hit $2.7 billion, a 31% year-over-year increase, per Enrich Labs
Pro tip: Use Shopify's growing ecosystem to your advantage. The platform's investments in one-click checkout, AI-powered product recommendations, and native analytics tools are free performance lifts. Make sure you've enabled Shop Pay (more on its impact below) and are using Shopify's built-in A/B testing features if you're on a plan that supports them.
How Does Shop Pay Affect Shopify Conversion Rates?
Shop Pay is Shopify's accelerated checkout option, and it's one of the strongest single-variable conversion levers available to merchants. One-tap payment flows remove the friction that kills conversions at the final step.
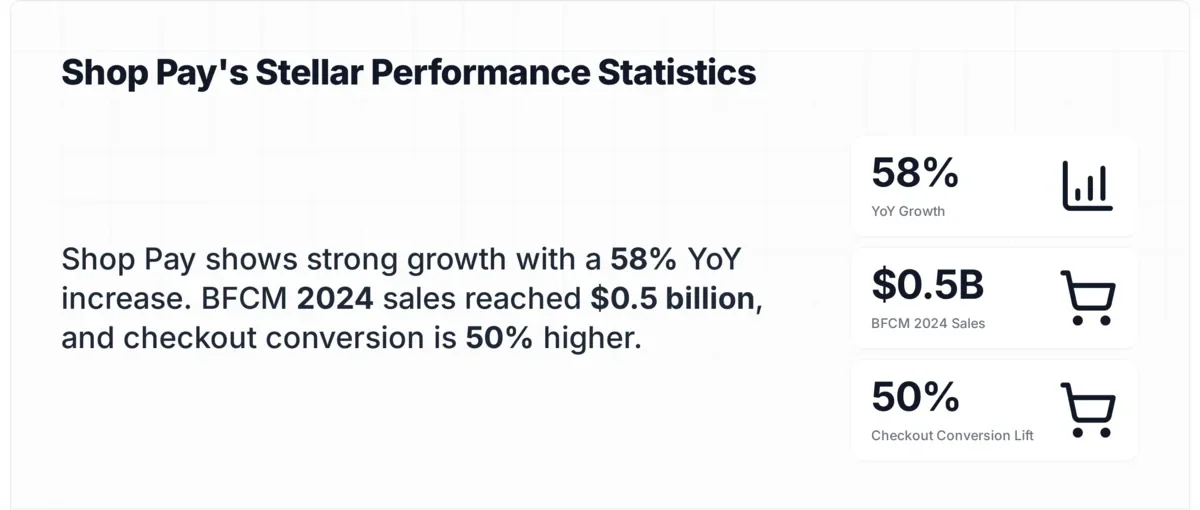
According to Shopify's BFCM 2024 report, Shop Pay usage surged 58% year-over-year during Black Friday-Cyber Monday, contributing to $11.5 billion in total merchant sales that weekend.
That 58% usage jump isn't just adoption growing. It reflects buyer preference. When customers have a saved payment method with a one-tap flow, they convert at significantly higher rates than those going through a standard multi-step checkout. Shopify doesn't publish exact conversion lift percentages for Shop Pay publicly, but the directional impact is clear from the BFCM data.
If you haven't enabled Shop Pay, do it today. It's free and takes five minutes to activate in your Shopify admin. For merchants already using it, make sure the Shop Pay button is prominently positioned above the fold on product pages, not just in the cart.
Shop Pay Impact on BFCM 2024
What Are the Most Effective Ways to Improve Shopify Conversion Rates?
Conversion rate optimization on Shopify comes down to reducing friction at decision points. After analyzing thousands of Shopify stores, I've found that the merchants who improve fastest focus on three areas: checkout clarity, mobile experience, and targeted messaging.
Here are the tactics that consistently move the needle, ranked by typical impact:
1. Deploy exit-intent and high-intent popups. Exit-intent popups on Shopify catch visitors at the moment of abandonment with a relevant offer (free shipping thresholds, limited-time discounts, or back-in-stock alerts). The timing matters more than the offer itself. A popup triggered after 30 seconds of inactivity on a product page converts differently than one fired on scroll. You can use a popup builder app like Popupsmart for your Shopify store.
2. Prioritize mobile checkout speed. With 70%+ of traffic on mobile, a one-second delay in load time can drop conversion by 7%. Compress images, enable lazy loading for below-the-fold content, and cut unnecessary Shopify apps that inject JavaScript into your storefront. Test your checkout flow on a mid-range Android phone, not just your iPhone.
3. Add social proof at decision points. Place reviews directly on product pages, not buried in a separate tab. Star ratings in collection pages help too.
4. Run continuous A/B tests on copy and CTAs. A/B testing your Shopify popups and page elements is how you compound small gains. A 0.2% lift from a better headline plus a 0.3% lift from improved product images stacks into meaningful revenue over a quarter.
5. Simplify navigation and reduce choice overload. If your homepage shows 40 products, most visitors won't click any. Curate collections, use "best sellers" sections, and guide visitors toward a smaller set of high-margin items. Less choice often means higher conversion.
What Do Shopify Conversion Rate Case Studies Show?
Aggregate statistics tell you what's normal. Case studies show what's possible. Two recent examples illustrate how focused optimization produces outsized results.
According to Aumento Infoway, a Shopify brand increased its conversion rate from 1.2% to 1.68% in just eight weeks, a 40% improvement.
The changes weren't dramatic. They optimized product page layout, improved mobile responsiveness, and added trust signals at checkout. No redesign, no platform migration. Just targeted fixes based on funnel analysis data. Moving from 1.2% to 1.68% might sound modest, but that's nearly 40% more revenue from the same traffic.
A separate case study from EcomRolodex documented a 61% increase in conversions within 30 days through a phased optimization approach.
Their method focused on fixing the biggest leaks first: cart abandonment triggers, checkout page clarity, and product page load speed. The 61% lift came from addressing issues that had been bleeding conversions for months but hadn't been measured.
What to do: Start by identifying your biggest funnel drop-off. Use Shopify's analytics or a tool like Google Analytics 4 to find where visitors leave. If most drop-offs happen between product page and cart, your product pages need work. If they happen at checkout, focus there instead. The merchants who improve fastest fix one stage at a time rather than optimizing everything simultaneously.
How Do You Calculate Your Shopify Conversion Rate?
Your Shopify conversion rate equals the number of purchases divided by the number of sessions, multiplied by 100. Shopify calculates this automatically in your analytics dashboard, but understanding the formula helps you spot measurement problems.
The formula: CVR = (Number of Purchases / Number of Sessions) x 100
For example, if your store had 10,000 sessions last month and 140 purchases, your conversion rate is 1.4%. Shopify uses sessions (not unique visitors) as the denominator, which means one person visiting three times counts as three sessions. This is important because it means stores with high returning-visitor rates will show lower conversion rates than stores where most traffic is new.
Beyond basic CVR, two related metrics matter for benchmarking:
| Metric | Formula | Why It Matters |
|---|---|---|
| Average Order Value (AOV) | Total Revenue / Total Orders | A high CVR with low AOV may mean you're discounting too aggressively |
| Revenue Per Visitor (RPV) | Total Revenue / Total Sessions | Combines CVR and AOV into a single metric; the truest performance indicator |
Tip: Don't obsess over conversion rate in isolation. According to Synder, the average US-based Shopify merchant earns $72 in profit per customer, with top earners hitting $149. If your conversion rate is 1% but your AOV is $200, you may be healthier than a store converting at 3% with a $30 AOV. Track revenue per visitor as your north star metric.
What Shopify Conversion Rate Trends Should You Watch in 2026?
Three shifts are reshaping how Shopify stores convert visitors in 2026, and each creates opportunities for merchants who move early.
AI-referred traffic is growing fast but converts differently. According to Contentsquare, AI-referred traffic conversion rates rose 55% year-over-year to reach 1.3%. That's still below organic search conversion rates, but the growth trajectory suggests AI-driven product discovery (through ChatGPT, Perplexity, and Google AI Overviews) will become a meaningful traffic source for Shopify stores. Merchants who optimize their product pages for AI readability (clear specs, structured data, comparison-friendly layouts) will capture this traffic earlier.
Checkout accelerators are table stakes. Shop Pay's 58% usage surge during BFCM 2024 signals a broader shift. Buyers expect one-tap purchasing. Stores still running multi-step checkouts without express payment options are leaving money on the table, particularly on mobile where every additional tap loses visitors.
Subscription and replenishment models are lifting lifetime conversion rates. More Shopify merchants are offering "subscribe and save" options that shift the conversion question from "will they buy once?" to "will they commit to recurring purchases?" For consumable products (supplements, coffee, skincare), this approach lifts both initial conversion rates and customer lifetime value. It's a good benchmark strategy for stores with repeat-purchase products.
How Does Shopify Compare to Other E-commerce Platforms?
Shopify's 1.4% average conversion rate sits slightly below the global e-commerce average of 1.89%, according to IRP Commerce data via Convertibles. That gap isn't a platform weakness. It reflects Shopify's merchant composition.
Shopify powers approximately 5.6 million active online stores and holds 30% of US e-commerce market share. Many of those stores are new businesses still building their audience. Platforms with higher average conversion rates often have smaller, more mature merchant bases.
| Benchmark | Rate | Source |
|---|---|---|
| Shopify average | 1.4% | Multiple sources (2024–2026) |
| Global ecommerce average | 1.89% | IRP Commerce |
| Good ecommerce rate | 2.5% – 3.0% | Nudgify / Shopify Blog |
| December 2024 platform benchmark | 2.18% | Speed Commerce |
| Shopify top 20% stores | 3.2%+ | Red Stag Fulfillment |
If you're comparing your Shopify store against platforms like BigCommerce or WooCommerce, make sure you're comparing like-for-like. Filter your analytics by traffic source and device type. A fair comparison is your store's organic desktop conversion rate against the platform-wide average, not your blended rate including all that low-intent social traffic.
How I Gathered Shopify Conversion Rate Stats & Conclusion
Every statistic in this post was pulled from its original source and verified against at least one corroborating data point. The core Shopify conversion rate benchmarks (1.4% average, 3.2% top 20%, 4.7% top 10%) appear consistently across Red Stag Fulfillment, Uptek, Craftberry, LittleData, and TrueProfit, all citing either Shopify's own analytics or LittleData's aggregated merchant data.
Platform-level figures like GMV and revenue came directly from Shopify's investor reports and official newsroom, cross-checked against third-party analyses from TechnologyChecker and Enrich Labs. Industry-specific conversion rates drew from Shopify Blog's benchmarks, Blend Commerce's 2026 analysis, and IRP Commerce's cross-platform data. The mobile versus desktop split is consistently reported by Uptek, Nudgify, and Red Stag Fulfillment with minimal variance.
Where sources disagreed (for example, Craftberry reports desktop conversion at 3.9% versus the more commonly cited 1.9%), I noted the discrepancy and used the figure supported by more sources. All data points are from 2024 or later unless explicitly marked otherwise.
Shopify conversion rate statistics paint a clear picture for 2026: most stores convert around 1.4%, the best stores hit 3.2% or higher, and the gap between them comes down to mobile optimization, checkout speed, and targeted messaging. If you're looking to close that gap, the fastest wins come from enabling Shop Pay, fixing mobile page speed, and adding multi-step forms and popups that capture leads at the right moment. You don't need a complete redesign. You need to find the one or two friction points costing you the most orders and fix those first.
FAQ About Shopify Conversion Rate Statistics
What is a good conversion rate in Shopify?
A good conversion rate on Shopify is above 2%, which puts you ahead of the platform-wide median. According to Red Stag Fulfillment, stores converting at 3.2% or higher rank in the top 20%, and those above 4.7% are in the top 10%. Your target should depend on your industry. A food and beverage store converting at 2% is underperforming its category, while an electronics store at 2% is doing well. Always compare against your specific niche, not the Shopify-wide average of 1.4%.
What is the average e-commerce conversion rate by industry?
Industry averages vary substantially. Food and beverage leads at 6.22%, multi-brand retail sits at 3.93%, and fashion e-commerce ranges between 2.9% and 3.3% in the broader market. On Shopify specifically, fashion stores tend to convert between 1.6% and 1.9%. The global all-industry e-commerce average is 1.89% according to IRP Commerce. These benchmarks for what counts as a good conversion rate shift quarterly, so check current data before making strategic decisions.
How do you calculate conversion rate for e-commerce?
The standard formula is: Conversion Rate = (Number of Purchases / Number of Sessions) x 100. If your store had 5,000 sessions and 75 purchases, your conversion rate is 1.5%. Shopify calculates this automatically in your analytics dashboard using sessions as the denominator, not unique visitors. One person visiting your store three times counts as three sessions. For a fuller picture, also track Average Order Value (Total Revenue / Total Orders) and Revenue Per Visitor (Total Revenue / Sessions).
What is a good checkout conversion rate benchmark?
Checkout conversion rate (the percentage of visitors who reach checkout and actually complete a purchase) typically ranges from 40% to 65% on Shopify. Stores using Shop Pay and other express payment methods tend to sit at the higher end of this range because one-tap flows eliminate the friction of manual form entry. If your checkout conversion rate drops below 40%, investigate common culprits: surprise shipping costs at the final step, forced account creation, or insufficient payment options.
What is the average online conversion rate in 2026?
The average online conversion rate across all e-commerce platforms is approximately 1.89%, according to IRP Commerce. Shopify's platform average of 1.4% falls slightly below this, while the global e-commerce growth trends pushes the overall benchmark higher each year. Statista reported 1.6% of global e-commerce visits converted in Q3 2025. The range of "normal" spans from 1% to 3%, with industry, device mix, and traffic quality being the primary variables.
How can I improve my Shopify store's conversion rate?
Start with your biggest funnel leak. Use Shopify analytics to identify where visitors drop off. If they leave on product pages, improve images, add reviews, and clarify your value proposition. If they abandon at checkout, enable Shop Pay, show shipping costs early, and remove forced account creation. Well-timed popups with relevant offers (free shipping bars, exit-intent discounts, back-in-stock alerts) can move conversion rates measurably.

How would you rate your experience with this article? 😊