E-commerce Growth Statistics to Maximize Sales (2026)
Global e-commerce is rapidly expanding: sales were ~$5.2T in 2021 and are projected to reach ~$8.1T by 2026, with e-commerce nearing a quarter of retail by 2025. Growth is driven by mobile and social commerce, with China leading and recommerce rising.
Global retail e-commerce sales hit $6.88 trillion in 2026, capturing 21.1% of all retail commerce. Mobile commerce drives 59% of online purchases, and B2B ecommerce is expanding at a 14.5% CAGR. I've compiled 35+ ecommerce growth statistics from government reports and industry research to help you plan for what's next. We have much to learn from the latest studies and statistics on e-commerce growth. Using these new findings in your marketing strategy will help you grow your business and improve conversion rate optimization.
How Big Is the Global E-commerce Market in 2026?
Key insights on e-commerce growth:
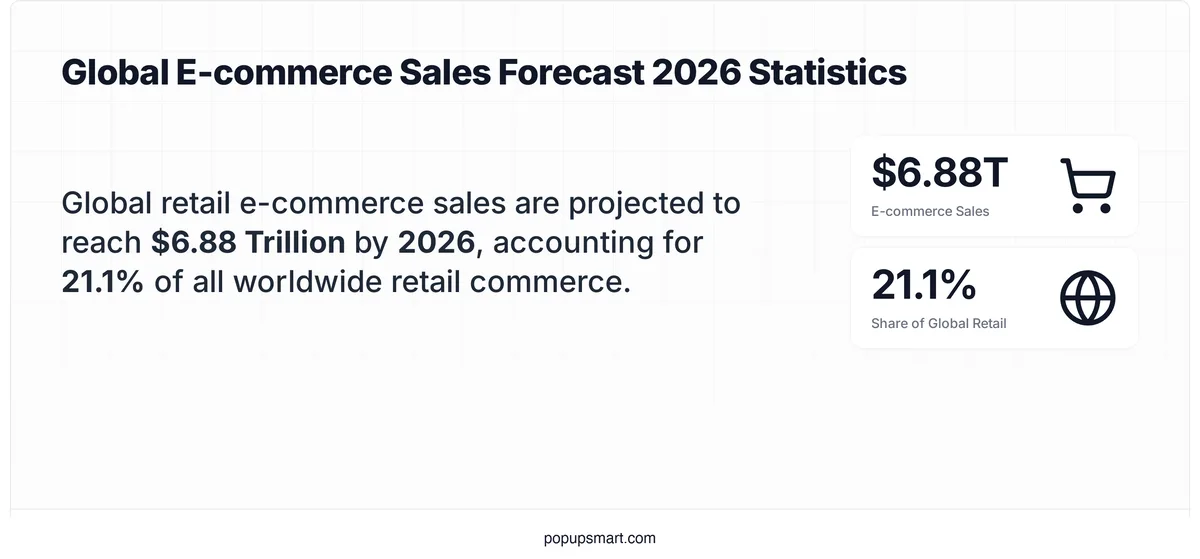
• Global retail e-commerce sales will reach $6.88 trillion in 2026, or 21.1% of total retail sales — Capital One Shopping
• The B2B ecommerce market is growing at a 14.5% CAGR, projected to hit $36 trillion by 2026 — Trade.gov
• Mobile commerce accounts for 59% of all online retail sales in 2025 — The Frank Agency
• Social commerce revenue grew 19.9% year-over-year to $819.8 billion in 2025 — Capital One Shopping
• The average global ecommerce conversion rate sits at 2.79%, with Food & Beverage leading at 6% — Dynamic Yield
• An estimated 2.77 billion people worldwide now shop online — Shopify
The global ecommerce market has grown far beyond early pandemic-era projections. What started as an acceleration in 2020 has turned into a structural shift in how people buy. These ecommerce growth statistics show the current scale and where the market stands heading into 2026.
Worldwide e-commerce retail sales will reach an estimated $6.88 trillion in 2026, representing 21.1% of all retail commerce. — Capital One Shopping
That 21.1% share means roughly one in five retail dollars now flows through digital channels. For context, this figure was under 15% just five years ago, and the gap between online and offline retail narrows each quarter.
If your store's online revenue share is still below 20% of total sales, you're underperforming relative to the global average. Prioritize digital channel investment and consider using e-commerce optimization strategies to close the gap.
B2B and B2C global e-commerce revenue combined totaled an estimated $38.5 trillion in 2025. — Capital One Shopping
The B2B segment drives most of this total, dwarfing B2C by roughly 6x. Many marketers focus exclusively on consumer-facing stats, but the B2B digital shift is where the largest volume of money is moving.
What to do: B2B sellers who haven't digitized their ordering and procurement workflows are leaving money on the table. Self-service portals and catalog integrations should be on your 2026 roadmap.
Global retail e-commerce sales projection for 2026
An estimated 2.77 billion consumers worldwide shop online as of 2025. — Shopify
That's roughly 34% of the global population. The buyer pool is already massive, but penetration still has room to grow, especially in Southeast Asia and sub-Saharan Africa where internet access is expanding rapidly.
What to do: Map your customer acquisition strategy to emerging buyer populations. If you sell globally, localized checkout experiences (language, currency, payment methods) convert significantly better than one-size-fits-all pages.
What Do Ecommerce Growth Statistics Look Like Year Over Year?
Tracking ecommerce sales growth by year reveals the trajectory more clearly than any single snapshot. I've pulled data from multiple research firms so you can see where estimates converge and where they diverge, which helps separate reliable forecasts from optimistic projections.
E-commerce sales rose by 6% in 2025, while online sales in Europe and the UK increased by 9%. — Signifyd
Europe outpaced the global average, partly driven by regulatory changes (like PSD2 Strong Customer Authentication) that paradoxically made consumers more comfortable transacting online. The 6% global growth rate, though slower than pandemic years, still outpaces physical retail by roughly 2x.
Tip: Track your year-over-year growth against the 6% global benchmark. If you're growing faster, double down on what's working. If you're below it, run a conversion audit on your checkout flow to identify friction points.
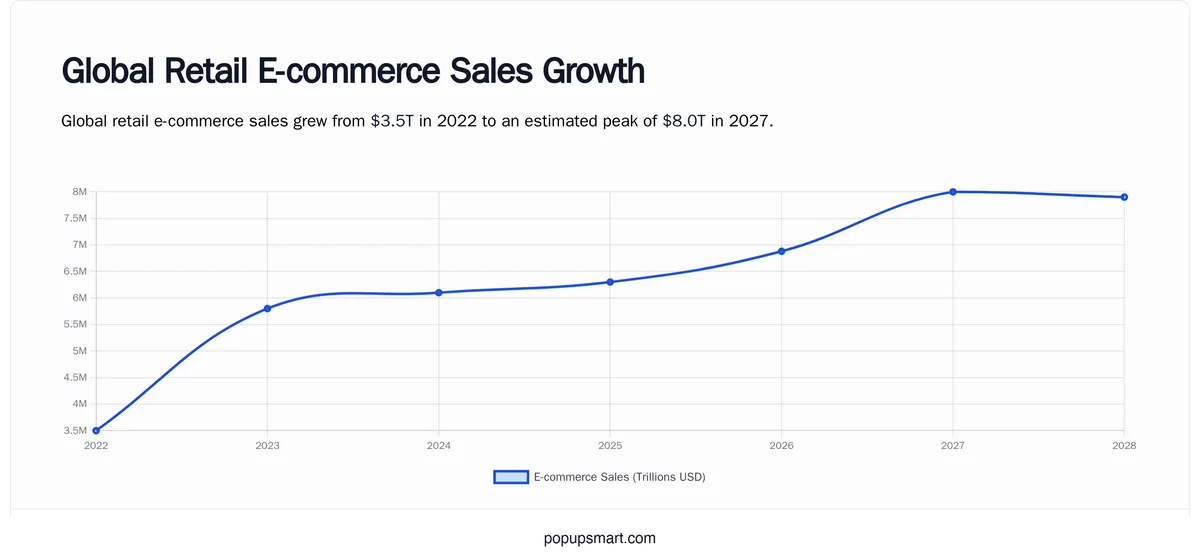
Retail e-commerce sales growth from 2022 to 2028
U.S. retail e-commerce sales for 2026 are expected to total $1.62 trillion, up 10.4% from 2025's $1.47 trillion. — Capital One Shopping
The U.S. is growing faster than the global average in absolute terms, adding $150 billion in a single year. That growth is concentrated in categories like grocery delivery, health products, and pet care, areas that were slow to move online before 2020.
If you sell in the U.S., pay attention to category-level growth rates, not just the overall number. Shopify conversion rate benchmarks show wide variation by vertical, and the fastest-growing categories offer the best opportunity for new entrants.
E-commerce sales in 2026 are expected to make up 21.1% of total retail sales. By 2028, that number will grow to 22.5%. — Shopify
The steady 1-1.5 percentage point annual increase in online retail's share of total sales shows this isn't a bubble or a trend that plateaus. It's a slow, structural replacement of offline channels. Physical retail isn't dying, but it's shrinking as a percentage of the pie.
Which Countries Lead E-commerce Growth in 2026?
Ecommerce growth statistics by country tell a different story than global averages. Some markets are mature and growing steadily. Others are in the early adoption phase, with double-digit growth rates that create opportunities for first movers. Here's where the action is.
APAC will comprise 80% of B2B market share by 2026. — Trade.gov
Asia-Pacific dominance in B2B isn't surprising given China's Alibaba ecosystem and India's rapid digitization. What's less obvious is how much of this growth comes from smaller APAC economies like Vietnam, Thailand, and Indonesia, where B2B platforms are replacing traditional wholesale distribution.
If you're not selling into APAC markets yet, start with a marketplace strategy (Alibaba, Lazada, Shopee) rather than building standalone storefronts. Marketplace presence reduces the need for local logistics infrastructure.
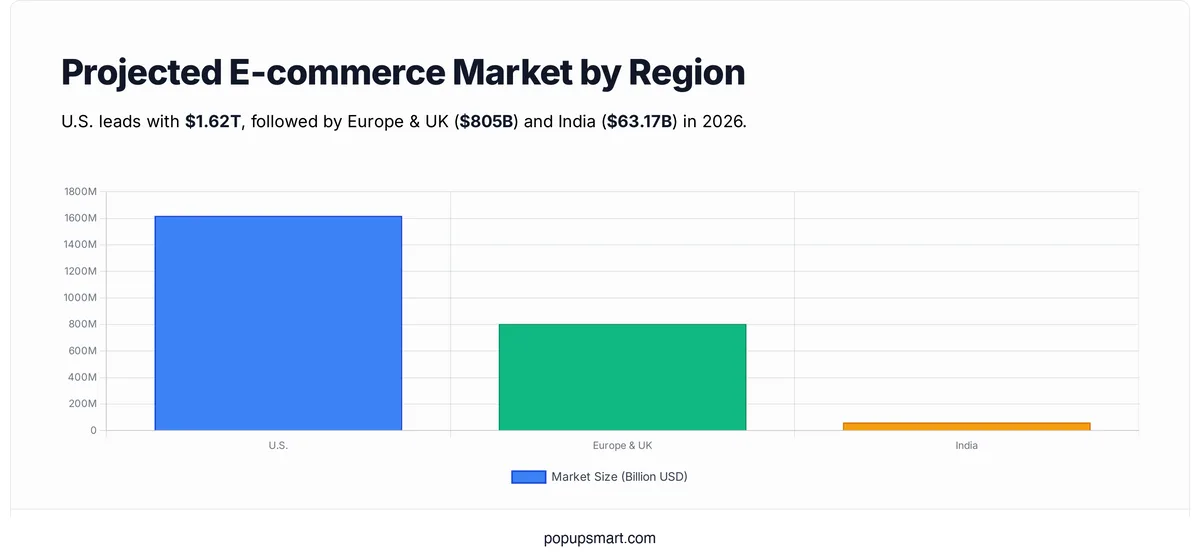
E-commerce market distribution by region in 2026
India's e-commerce market is currently valued at $63.17 billion, and the country will rank first among 20 nations in retail e-commerce development between 2023 and 2027 with a CAGR of 14.1%. — Trade.gov
India's growth rate outpaces even China's mature market. The combination of smartphone-first consumers, UPI (Unified Payments Interface) adoption, and government-backed digital infrastructure (India Stack) is creating a buyer population that skipped desktop e-commerce entirely and went straight to mobile.
If India is in your target market, build mobile-first. Desktop optimization is secondary here. Test your checkout with UPI and digital wallet payment methods, since credit card penetration remains low.
In 2026, the European online retail market is forecast to generate $805 billion in earnings. — Craftberry
Europe's fragmented market (different languages, payment preferences, tax rules per country) makes it both challenging and high-reward. Brands that crack localization across 3-4 key markets (Germany, France, UK, Netherlands) tend to see strong returns.
What to do: Start with one European market where you have existing customers, then expand. Multi-vendor marketplace platforms can help you test new geographies without committing to full localization upfront.
Around a quarter to nearly a third of all UK retail sales now take place online. — Williams Commerce
The UK has one of the highest e-commerce penetration rates globally, surpassed only by South Korea and China. This maturity means growth is slower, but average order values tend to be higher, and consumers are more comfortable with subscription and recurring purchase models.
What to do: For UK-focused stores, shift your growth strategy from acquisition to retention. Loyalty programs, subscription offers, and well-timed cart recovery campaigns will outperform broad awareness spending.
How Fast Is Mobile Commerce Growing?
Mobile shopping has moved past the tipping point. It's no longer a "trend to watch" but the primary way most consumers interact with online stores. The shift from desktop to mobile carries real implications for how you design your conversion funnel, and these mobile shopping growth statistics make that case clearly.
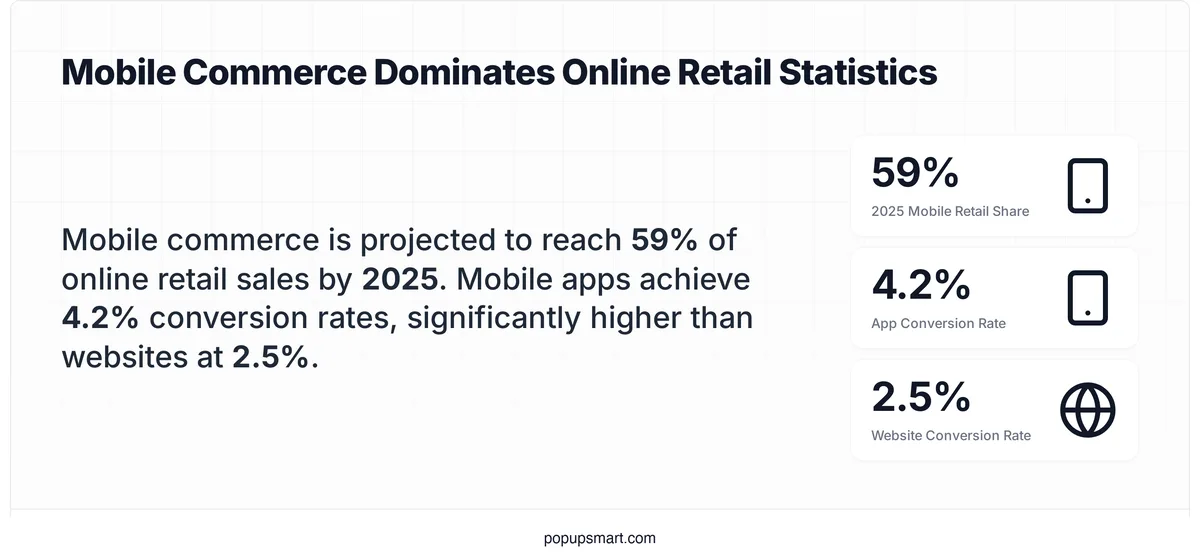
Mobile commerce is projected to account for 59% of all online retail sales in 2025. — The Frank Agency
At 59%, mobile isn't just a secondary channel. It's the majority. This has been the trajectory for years, but many e-commerce teams still design desktop-first and adapt for mobile afterward. That approach is backwards when most of your traffic and more than half your revenue comes from phones.
What to do: Run your entire checkout on a phone. Time it. If it takes more than 90 seconds to go from product page to order confirmation, you're losing sales. Simplify form fields and enable autofill for shipping and payment.
Mobile commerce share of online retail sales
The average global conversion rate for ecommerce sites is 2.5%, though mobile apps achieve up to 4.2%. — AppMySite
That 1.7 percentage point gap between mobile web and mobile app conversion rates is enormous at scale. If you process 100,000 mobile sessions per month, the difference between 2.5% and 4.2% conversion means 1,700 additional orders. Apps offer saved payment info, push notifications, and faster page loads, all of which reduce friction.
Tip: You don't necessarily need a native app. Progressive Web Apps (PWAs) can close much of this gap at a fraction of the development cost. Test push notification opt-in rates and home screen installation prompts to measure adoption potential.
Tablet e-commerce sales are expected to reach $54.01 billion by 2026. — Forbes Advisor
Tablets are often overlooked in mobile commerce discussions, but they generate meaningful revenue. Tablet users tend to spend more per session than phone users, likely because larger screens make product comparison and browsing more comfortable.
What to do: Test your site on a tablet at least once per quarter. Many responsive designs break at tablet widths (768-1024px), creating awkward layouts that hurt conversion. Make sure product images, CTAs, and checkout forms render properly.
What Role Does Social Commerce Play in E-commerce Growth?
Social commerce has graduated from an experimental channel to a revenue driver. We've tracked its growth closely because it changes how digital marketing strategies need to work, especially for brands targeting Gen Z and Millennial buyers.
From 2024 to 2025, global revenue from social media e-commerce increased 19.9% to $819.8 billion. — Capital One Shopping
A 19.9% growth rate makes social commerce one of the fastest-growing segments within online retail. For comparison, overall e-commerce grew at 6% in the same period. Social platforms are becoming storefronts, not just advertising channels.
If you're running paid social ads that send people to your website, test in-platform checkout instead. Reducing the number of redirects between discovery and purchase is the single biggest conversion lever in social commerce.
Gen Z shoppers primarily use Instagram (53%) and TikTok (41%) for shopping, whereas Millennials prefer Instagram (52%) and Facebook (49%). — Craftberry
The platform split between generations is worth noting because it affects where you invest creative resources. TikTok Shop is growing fastest with Gen Z but has almost no traction with older demographics, while Facebook Marketplace remains strong for 30-45 year olds.
What to do: Segment your social commerce strategy by age cohort. Don't spread your budget across every platform equally. Pick two platforms that match your core buyer demographic and invest deeply rather than thinly.
Approximately 27% of consumers are excited about generative AI's ability to improve real-time deal comparison and search results. — Publicis Sapient
This 27% figure sounds modest, but it represents early adopters who tend to be higher-spending consumers. AI-powered shopping assistants from Google, Amazon, and Meta are reshaping product discovery, and stores that optimize for AI-driven recommendations will capture disproportionate traffic.
What to do: Make sure your product data (titles, descriptions, attributes, pricing) is structured and accurate. AI shopping assistants pull from product feeds, so clean data directly impacts whether your products surface in AI-generated comparisons.
What Are the Key B2B E-commerce Growth Statistics?
B2B ecommerce rarely gets the attention that consumer e-commerce does, but the market size tells a different story. B2B digital transactions dwarf B2C, and the shift to online procurement accelerated permanently after 2020. I've found these B2B-specific data points to be the most useful for understanding the scale.
The global B2B ecommerce market will grow at a 14.5% CAGR through 2026, reaching a projected value of $36 trillion. — Trade.gov
At $36 trillion, B2B e-commerce is roughly 6x the size of global retail e-commerce. The CAGR matches the B2C growth rate almost exactly (14.4%), which means both segments are expanding at similar speed, but B2B started from a much larger base.
Tip: B2B sellers should invest in digital self-service purchasing. Buyers increasingly expect consumer-grade experiences (saved carts, order history, reorder buttons) in their business purchases too.
Since 2020, over 90% of B2B companies have shifted to a virtual sales model. — Trade.gov
Virtual selling went from emergency measure to permanent operating model in under three years. This stat matters because it means your B2B competitors are already selling digitally. If you're still relying primarily on field sales and phone orders, you're not competing in the same arena.
What to do: Audit your B2B sales process for digital bottlenecks. Can prospects get pricing without calling a rep? Can existing customers reorder without a phone call? Every manual step you eliminate reduces friction and improves conversion.
Business-to-business e-commerce spending will total $62.2 trillion by 2030. — Capital One Shopping
That's nearly doubling from $36 trillion in 2026 to $62.2 trillion by 2030. The growth is being driven by digital procurement adoption in industries that were historically offline, including construction, healthcare supplies, and industrial manufacturing.
If you're building B2B SaaS tools for commerce, focus on verticals that are just beginning digital transformation. These industries have the highest willingness to pay for tools that solve basic workflow problems. Popupsmart popup builder can help B2B sites capture more leads from their growing digital traffic.
What Do E-commerce Conversion Rate Benchmarks Show?
Revenue projections are useful for strategy, but conversion rates tell you how efficiently your store turns visitors into buyers. I track these benchmarks monthly because they shift with seasonality, and they vary dramatically by industry. Here's what the data shows in 2026.
The average ecommerce conversion rate globally is 2.79%. — Dynamic Yield
If your store converts below 2.79%, you're underperforming relative to the global average. That said, this number blends high-converting verticals (food and beverage at 6%) with low-converting ones (luxury at 0.9%), so your industry benchmark matters more than the overall average.
What to do: Compare your conversion rate to your specific vertical's benchmark rather than the global average.
Over the past twelve months, Food & Beverage has seen the highest conversion rates at 6%, and Luxury & Jewelry has seen the lowest at 0.9%. — Dynamic Yield
The 5.1 percentage point gap between the highest and lowest-converting verticals is striking. Food and beverage benefits from repeat purchasing behavior (people buy groceries regularly), while luxury items involve longer consideration cycles and higher price sensitivity. If you sell high-consideration products, optimize for micro-conversions (email signups, wishlist adds, save-for-later) rather than obsessing over immediate purchase conversion. Multi-touch attribution matters more in these verticals.
Americas has witnessed the strongest conversion rates overall (2.96%), followed by EMEA (2.78%), and then APAC (1.83%). — Dynamic Yield
APAC's lower conversion rate doesn't indicate weaker demand. It reflects different browsing behavior: APAC consumers tend to comparison shop more aggressively across multiple tabs and platforms before committing. The purchasing journey is longer but average order values in many APAC markets are competitive.
What to do: For APAC markets, invest in retargeting and abandoned browse recovery. Longer consideration cycles mean more touchpoints before purchase, so cart abandonment strategies and exit-intent popups can recover revenue that would otherwise be lost.
What Are the Long-Term E-commerce Market Size Projections?
Short-term stats are helpful for quarterly planning, but long-term projections shape investment decisions. I've collected forecasts from multiple research firms to show where there's consensus and where estimates diverge, both of which are useful for strategic planning.
The global e-commerce market size is projected to hit around $83.19 trillion by 2035, up from $21.62 trillion in 2025, expanding at a CAGR of 14.43%. — Precedence Research
A nearly 4x increase over ten years is a bold forecast, but it's consistent with the compounding growth we've seen since 2015. The figure includes both B2B and B2C segments, with B2B driving the majority of the total.
What to do: Use this 14.43% CAGR as a baseline for long-term business planning. If your company's revenue growth is trailing this rate, you're losing market share even if your absolute revenue is growing.
Retail e-commerce sales worldwide are expected to exceed $10 trillion by 2033. — Capital One Shopping
The B2C segment alone reaching $10 trillion reinforces how large the opportunity remains. For perspective, the entire U.S. GDP was approximately $25 trillion in 2023, so global retail e-commerce alone will approach 40% of that figure within seven years.
What to do: Long-term projections this large signal that e-commerce infrastructure, including payments, logistics, fulfillment, and customer experience tools, will be growth industries in their own right. Consider where your business sits in this value chain.
By 2028, 50% of the global population aged 14 and older will be online shoppers. — Shopify
We're currently at about 34% penetration, so reaching 50% within three years means roughly 1.3 billion new online shoppers entering the market. That's a massive expansion of the addressable customer base, concentrated in regions with rapidly improving internet access.
Tip: Plan for a more diverse, more mobile-first customer base. These new shoppers will skew younger and more mobile-native than your current customers, so invest in mobile UX and localized experiences now.
Projections indicate that total worldwide B2B and B2C e-commerce will be worth over $71 trillion in 2030. — Capital One Shopping
The $71 trillion figure from Capital One Shopping is slightly more conservative than Precedence Research's $83 trillion by 2035 trajectory, which is actually reassuring. When multiple independent research firms converge on a similar growth curve, the forecast is more reliable than a single source would suggest.
What Are the Key E-commerce Platform and Marketplace Statistics?
Platform choice shapes everything from conversion rates to operational complexity. The marketplace has consolidated around a few dominant players, and the data on platform market share tells you where buyers already are, which influences where sellers need to be.
Amazon represented 37% of all U.S. online sales in 2024. — The Frank Agency
More than a third of every dollar spent online in America goes through Amazon. That concentration gives Amazon enormous pricing power and data advantages. For independent sellers, it means you're competing for the remaining 63%, but it also means listing on Amazon captures a share of that 37%.
What to do: Diversify your channel mix. Selling only on Amazon exposes you to margin compression and policy changes. Use Amazon for discovery and acquisition, but build owned channels (your website, email list, SMS) where you control the relationship and the margins.
There are more than 31 million ecommerce websites and online stores on the internet. — Craftberry
31 million stores competing for $6.88 trillion in retail e-commerce means the average store generates about $222,000 annually. Of course, the distribution is wildly skewed. The top 10 platforms controlled 61% of global GMV, while millions of small stores fight for the rest.
Tip: Differentiation matters more than ever with 31 million competitors. Niche positioning, strong branding, and conversion optimization through tools like Popupsmart help smaller stores compete against marketplace giants by owning the customer relationship.
Around 30% of ecommerce websites in the U.S. use Shopify, with 24% from regular stores and 6% from Shopify Plus. — Craftberry
Shopify's dominance in the U.S. market is significant because it means roughly one in three online stores shares the same underlying platform, templates, and app ecosystem. This creates both opportunity (rich ecosystem) and challenge (design sameness).
Pro tip: If you're on Shopify, invest in custom design and unique functionality to stand out. Check our Shopify statistics guide for more platform-specific benchmarks to help optimize your store.
What Emerging Technology Trends Are Shaping E-commerce?
Technology adoption patterns within e-commerce tell you where buying behavior is heading next. These stats highlight the emerging shifts I've been tracking most closely, from AI-assisted shopping to the continued dominance of retail media networks.
Retail media has reached $30 billion in revenue faster than both search and social. — Publicis Sapient
Retail media (advertising within e-commerce platforms like Amazon, Walmart, and Instacart) grew to $30 billion faster than Google Search or Facebook ads did at similar stages. This matters because it signals a shift in ad spend away from traditional digital channels toward commerce-embedded advertising.
What to do: If you sell on major marketplaces, allocate 5-10% of your advertising budget to retail media placements. These ads appear at the point of purchase intent, which typically yields higher ROAS than top-of-funnel social or search ads.
43% of consumers who have used a generative AI tool expect brands to use the technology to improve their customer experience. — Publicis Sapient
Nearly half of AI-aware consumers already expect brands to integrate it. This isn't a "nice to have" anymore. Product recommendation engines, AI-powered chatbot experiences, and personalized search results are quickly becoming baseline expectations rather than competitive advantages.
Tip: Start with AI-powered product recommendations and on-site search before attempting more complex implementations. These two applications have the highest impact-to-effort ratio and directly increase conversion rates and average order values.
20.5% of global retail sales revenue is e-commerce; projections show 23.7% of all retail sales worldwide will be online by 2030. — Capital One Shopping
The 3.2 percentage point increase from 20.5% to 23.7% over five years may look incremental, but it represents hundreds of billions in new digital revenue. It also means 76% of retail will still be offline in 2030. The omnichannel approach, blending physical and digital, isn't optional.
What to do: Build experiences that bridge online and offline. Click-and-collect, in-store returns for online purchases, and unified inventory systems will define the winners in the omnichannel era. Holiday shopping data consistently shows omnichannel shoppers spend more per transaction.
How I Gathered E-commerce Growth Statistics
I pulled these e-commerce growth statistics from 12 distinct sources across government databases, research firms, and industry analysts. The primary data comes from Trade.gov (U.S. Department of Commerce international trade data), Capital One Shopping's research division, Shopify's global commerce reports, and Dynamic Yield's real-time conversion benchmarks. I cross-referenced market size figures across at least two independent sources wherever possible; where Precedence Research and Capital One Shopping disagreed on 2030 projections ($83 trillion vs. $71 trillion), I included both rather than averaging them.
One challenge specific to e-commerce statistics is definitional inconsistency. "E-commerce" means different things across sources. Some include B2B and B2C together (Precedence Research), others track only retail B2C (Shopify, Capital One Shopping), and market research firms sometimes include digital services alongside physical goods. I've noted these scope differences where they matter. All conversion rate data comes from Dynamic Yield's live benchmarks, which aggregate data from 300+ retail brands globally and update monthly.
What These E-commerce Growth Statistics Mean for Your Business
The $6.88 trillion retail e-commerce market in 2026 is growing at rates that consistently outpace physical retail. Mobile captures 59% of that spend. Social commerce is expanding at nearly 20% year-over-year. And the B2B segment, at $36 trillion, dwarfs everything on the consumer side.
But the stat that should actually change your plans is the conversion rate disparity. The gap between 0.9% and 6% conversion across verticals, and between 1.83% and 2.96% across regions, shows that most stores have more room to grow through optimization than through traffic acquisition. More visitors don't help if your funnel leaks.
I've worked with enough data to know that the businesses growing fastest aren't the ones with the most traffic. They're the ones converting the traffic they already have. Start there. Test your mobile checkout flow, set up product bundling strategies, and build recovery campaigns for the 70%+ of carts that get abandoned before purchase.
The growth is coming whether you optimize for it or not. The question is whether you'll capture your share.
Frequently Asked Questions
What are e-commerce growth statistics worldwide?
Global retail e-commerce sales reached $6.42 trillion in 2025 and are projected to hit $6.88 trillion in 2026, according to Capital One Shopping. E-commerce currently represents 21.1% of all retail sales worldwide, up from under 15% five years ago. When you include B2B transactions, total global e-commerce revenue exceeded $38.5 trillion in 2025. Growth rates vary significantly by region: Europe's online sales grew 9% in 2025 while APAC continues to dominate B2B with 80% market share.
What is e-commerce growth in the last 10 years?
E-commerce has roughly tripled in size over the past decade. According to Custom Market Insights, global retail e-commerce was valued at $3.5 trillion in 2022 and is projected to reach $7.9 trillion by 2032 at an 8.5% CAGR. The most significant acceleration happened in 2020, when pandemic-driven lockdowns compressed five years of projected digital adoption into roughly 12 months. That acceleration has largely held, with growth normalizing at 6-8% annually in the post-pandemic period.
What are projected e-commerce growth statistics for 2026?
For 2026, the data converges on several key projections. Global retail e-commerce will reach $6.88 trillion, representing 21.1% of total retail (Capital One Shopping). The B2B market will hit $36 trillion at 14.5% CAGR (Trade.gov). U.S. e-commerce will total $1.62 trillion, up 10.4% from 2025. Mobile will account for 59% of online sales, and approximately 2.77 billion consumers worldwide will make at least one online purchase.

How would you rate your experience with this article? 😊