Holiday Shopping Statistics 2026: 50+ Key Insights
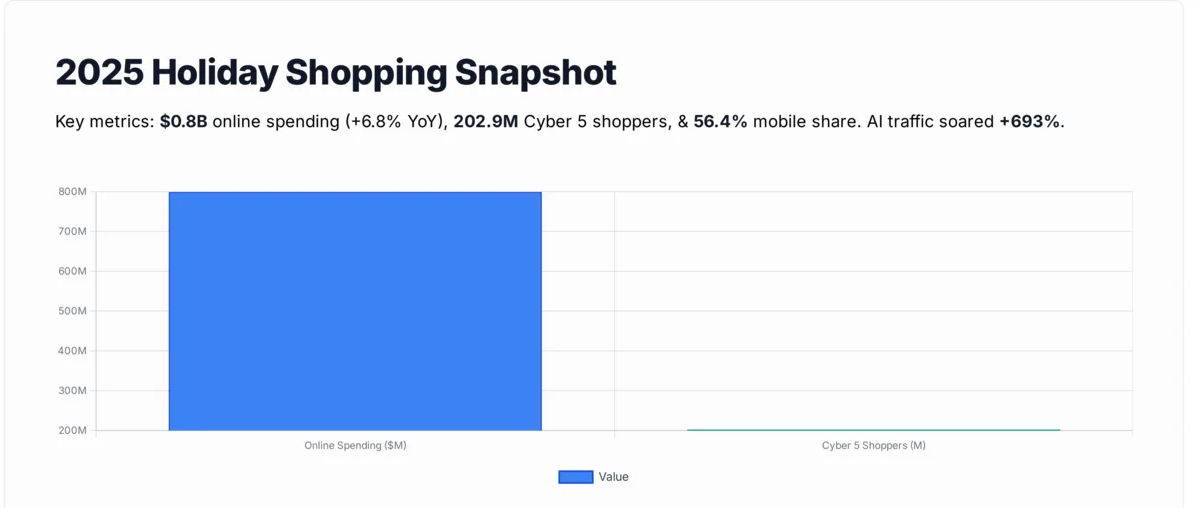
2025 holiday spending hit records: $257.8B online (+6.8%) and overall sales up 4.1% Nov–Dec, with mobile at 56.4% of transactions and AI influencing $262B. Cyber 5 drew 202.9M shoppers; per-person spend averaged ~$890 overall and $1,007 on gifts.
Holiday shopping statistics for the 2025-2026 season reveal record-breaking numbers: U.S. consumers spent $257.8 billion online during the holidays (up 6.8% year-over-year), mobile transactions claimed 56.4% of all online purchases, and AI-driven tools pushed a 693% traffic increase to retail sites. These 50+ statistics cover spending trends, consumer behavior, and forecasts from NRF, Adobe, and Salesforce.
How Much Did Consumers Spend During the 2025 Holiday Season?
• Mobile shopping crossed the majority threshold at 56.4% of all online transactions, up from 54.5% in 2024. — Adobe
• NRF's Retail Monitor data showed 2025 holiday sales grew 4.1% overall from November 1 through December 31. — NRF
• A record 202.9 million consumers shopped during the five-day Thanksgiving-through-Cyber Monday weekend. — Zeta Global
• AI and agent-driven tools accounted for $262 billion in holiday revenue through personalized recommendations. — Salesforce
• Americans planned to spend an average of $1,007 per person on holiday gifts, nearly identical to 2024 estimates. — Gallup
2025 holiday shopping season at a glance
The 2025 holiday season shattered previous spending records across both online and brick-and-mortar retail. Total retail holiday sales were forecast to surpass $1 trillion for the first time, and the final numbers backed that optimism. Below are the spending figures that defined the season.
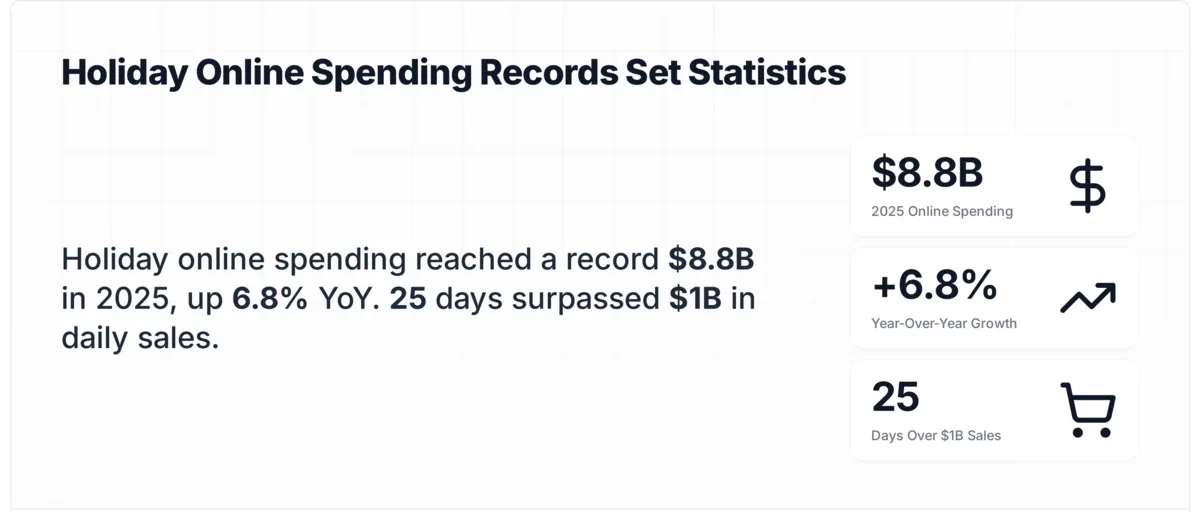
Record $257.8 Billion in Online Spending
Consumers spent $257.8 billion online from November 1 to December 31, 2025, up 6.8% year-over-year, setting a new e-commerce record. — Adobe Digital Insights
That 6.8% growth rate outpaced Adobe's own pre-season forecast. The acceleration came from deeper discounts, expanded product availability online, and growing consumer comfort with digital checkout. For e-commerce teams, this confirms that the ceiling for online holiday revenue hasn't been reached yet.
What to do: Start planning your holiday promotions by August. If your online store saw flat or declining traffic last season, audit your product pages for page speed and mobile usability well before the November rush.
25 Days With $4+ Billion in Daily Sales
Twenty-five individual days during the 2025 holiday period saw consumers spend more than $4 billion online in a single day, a jump from 18 days in 2024. — Adobe
This expansion from 18 to 25 days signals a longer, more sustained spending window. Consumers aren't concentrating purchases on Black Friday and Cyber Monday alone anymore. The spending halo stretches further into early November and late December.
What to do: Spread your promotional calendar across the full November-December window rather than front-loading everything into Cyber Week. Use seasonal campaign strategies to capture shoppers at different points in the season.
NRF Forecast: Holiday Sales Expected to Top $1 Trillion
In November, NRF forecast that holiday sales would grow between 3.7% and 4.2% above the prior year, exceeding $1 trillion in total sales for the first time. — NACS (citing NRF data)
Crossing the $1 trillion mark, even adjusted for inflation, represents a psychological milestone for the retail industry. NRF's confidence in that figure reflected strong employment numbers and rising consumer sentiment heading into Q4.
What to do: Use the $1 trillion benchmark in pitch decks and budget proposals to justify increased holiday marketing spend. Hard numbers from NRF carry weight with executives and stakeholders.
Holiday Sales Grew 4.1% (November Through December)
Based on Retail Monitor data, 2025 holiday sales from November 1 through December 31 grew 4.1%. — NRF
The 4.1% growth rate landed within the upper range of NRF's forecast, suggesting consumer resilience despite ongoing inflation concerns. The figure also exceeded the Deloitte forecast of 2.9% to 3.4% growth.
What to do: When building your 2026 holiday forecast, model a baseline of 3-4% growth and plan inventory accordingly. Overstocking risks are lower when the trend line is consistently positive.
Average Planned Spending: $890 Per Person
Consumers planned to spend $890.49 per person on average on holiday gifts, food, decorations, and other seasonal items. — NRF Holiday Survey
This was the second-highest amount on record, showing that per-capita spending remains stable despite cost-of-living pressures. The figure includes non-gift categories like food and decorations, which many retailers overlook.
What to do: Don't ignore non-gift categories in your holiday marketing. Decorations, seasonal food items, and party supplies represent a meaningful share of that $890 average. If your store sells any of these, promote them alongside gift-focused campaigns.
Online holiday spending reached $257.8 billion in 2025
Gallup: Americans Expected to Spend $1,007 on Gifts
Americans expected to spend an average of $1,007 on holiday gifts, nearly identical to their estimate at the same point in 2024. — Gallup
The stability in planned gift spending year-over-year suggests that consumers have internalized higher prices. They're not cutting back; they're budgeting for the new cost baseline. The $1,007 figure is gift-specific, separate from NRF's broader $890 average that includes food and decorations.
What to do: Segment your product catalog by price range and create gift guides at different budget tiers ($25, $50, $100, $200+). Make it easy for a shopper with a $1,000 budget to fill their list efficiently on your site.
PwC Survey: Average Gift Spend Rose to $770
According to PwC's Holiday Sentiment Survey (October 2025), the average projected gift spend reached $770, up from $721 in June. — PwC
The $49 increase between June and October suggests that consumer confidence strengthened as the season approached. Pre-season surveys often undercount final spending, so the actual numbers likely came in even higher.
What to do: Run early sentiment checks with your own customer base. If purchase intent rises between summer and fall, accelerate your ad spend ramp-up and inventory staging timeline to match.
What Were the Biggest Consumer Behavior Trends?
Consumer behavior during the 2025 holidays wasn't just about spending more. How, when, and why people shopped shifted in measurable ways. These holiday shopping statistics reveal the behavioral patterns that matter most for marketing teams.
87% of Shoppers Planned to Spend the Same or More
87% of shoppers planned to spend the same or more compared to 2024, up from 75% the year before. — Accenture
That 12-percentage-point jump in willingness to spend signals a shift in consumer sentiment. After years of inflation anxiety, shoppers appear to have adjusted their expectations and opened their wallets.
What to do: Lean into messaging that emphasizes value without defaulting to deep discounts. When 87% of shoppers plan to spend at prior-year levels or higher, you don't need to race to the bottom on pricing.
91% of U.S. Adults Plan to Celebrate Winter Holidays
Nearly all U.S. adults (91%) plan to celebrate winter holidays such as Christmas, Hanukkah, or Kwanzaa, in line with recent years. — NRF
This near-universal participation rate has remained stable for several years, confirming that the addressable market for holiday marketing is essentially the entire U.S. adult population. The 9% who don't celebrate still participate in some year-end spending.
What to do: Don't narrow your targeting too aggressively during the holidays. With 91% of adults participating, broader audience segments tend to outperform hyper-targeted campaigns for seasonal promotions.
45% of Consumers Started Shopping Before November
Nearly half (45%) of consumers planned to start holiday shopping before November. — Porch Group Media
Early shopping has become the norm, not the exception. Retailers who wait until Black Friday to launch campaigns miss nearly half their potential audience. October is now prime holiday shopping territory.
What to do: Launch your first holiday promotional wave in mid-October with early-bird offers and gift guides. Use Black Friday popups to capture email subscribers before the main event, then retarget them during peak weeks.
1 in 5 Consumers Will Spend $1,000+ on Holiday Shopping
One in five consumers planned to spend $1,000 or more on holiday shopping in 2025. — Drive Research
This high-value segment represents roughly 20% of shoppers but accounts for a disproportionate share of total revenue. Targeting them effectively can move the needle more than broad discount campaigns aimed at budget shoppers.
What to do: Create a VIP tier for your holiday promotions. Offer early access, exclusive bundles, or free premium gift wrapping to shoppers who signal high purchase intent through browsing behavior or past order history.
86% Say Inflation Impacted Their Holiday Purchasing
86% of holiday shoppers indicated that inflation impacted their holiday purchasing in 2025, with 69% engaging in deal-seeking behavior. — Bread Financial
Even as total spending rose, the way consumers spent changed. Two-thirds actively hunted for deals, compared items across retailers, and timed purchases around sales events. Price sensitivity and deal-seeking now coexist with record spending levels.
What to do: Make your deals visible and easy to compare. If you run promotions, show the original price alongside the discounted price clearly. Price transparency builds trust with inflation-conscious shoppers who are comparing across multiple tabs.

Nearly Half of Shoppers Spent More Than in 2024
Nearly half of shoppers spent more than in 2024, as in-store shopping, dining, and experiences remained central to the season. — ICSC
The experiential component of holiday shopping has returned with force. Consumers aren't just buying products; they're spending on dining, events, and in-store experiences. This blurs the line between retail and entertainment spending.
What to do: If you have a physical presence, invest in in-store holiday experiences. For online-only brands, create digital equivalents: virtual gift consultations, live shopping events, or interactive holiday gift finders.
How Did the Cyber 5 Weekend Perform in 2025?
The five-day stretch from Thanksgiving through Cyber Monday remains the single most concentrated shopping period of the year. In 2025, it set new records for both foot traffic and online transactions.
202.9 Million Shoppers During the Cyber 5 Weekend
A record 202.9 million consumers shopped during the five-day holiday weekend from Thanksgiving Day through Cyber Monday. — Zeta Global
That's roughly 60% of the entire U.S. population compressed into a five-day shopping window. The sheer volume creates opportunities for brands that are prepared and real risks for those whose sites or inventory can't handle the surge.
What to do: Stress-test your website infrastructure in October. Run load tests simulating 3x your normal peak traffic. If your site slows below a 2.5-second load time, you'll lose conversions during the most valuable hours of the year.
159 Million Expected to Shop on Super Saturday
NRF predicted a record 159 million consumers would turn out to shop on Super Saturday, the final Saturday before Christmas. — Forbes
Super Saturday has quietly become one of the biggest shopping days of the year, driven by last-minute gift buyers and procrastinators. The 159 million figure rivals Black Friday numbers, and these shoppers tend to be less price-sensitive because they're running out of time.
What to do: Keep your strongest promotions running through Super Saturday. Increase paid search budgets for gift-related keywords in the final week before Christmas, and promote urgency-driven messaging like guaranteed delivery deadlines.
December Retail Sales Growth Topped 4%
The resilient U.S. consumer pushed December retail sales growth past 4%. — Retail Dive
December historically determines whether the entire holiday season meets expectations. The 4%+ growth rate exceeded most analyst forecasts and demonstrated that consumer spending momentum carried through the full season rather than front-loading into November.
What to do: Don't pull back your marketing spend after Cyber Monday. December shoppers account for a significant share of total holiday revenue, and many are buying for themselves with gift cards and post-Christmas deals.
What Role Did Mobile Shopping Play in the 2025 Holidays?
Mobile commerce crossed a major threshold during the 2025 holiday season. For the first time, smartphones accounted for the majority of all online holiday transactions. These device preference statistics show how the shift played out.
Mobile vs. desktop holiday shopping comparison, 2025
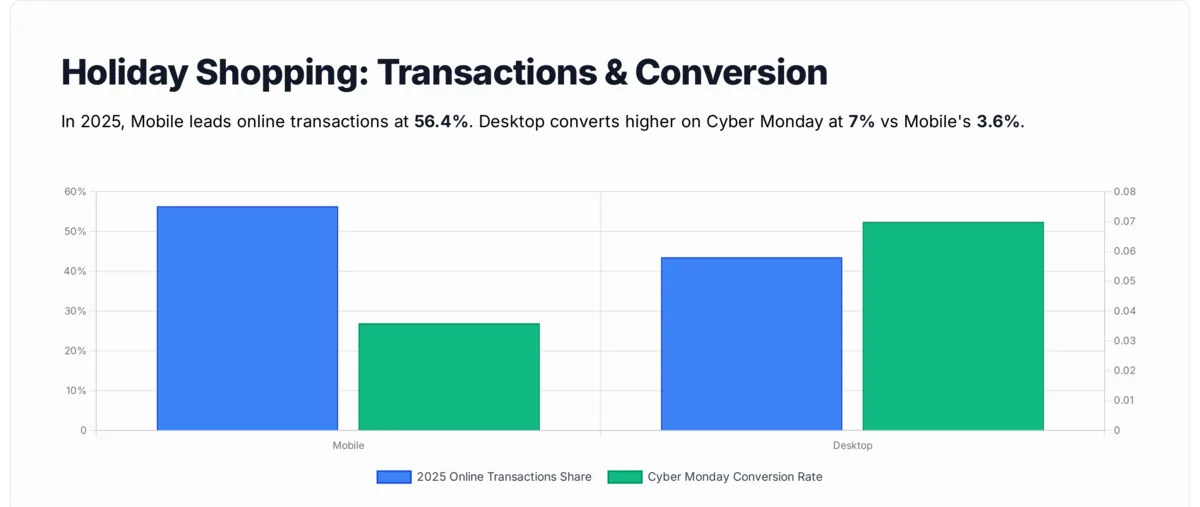
56.4% of Online Transactions Happened on Mobile
Mobile shopping hit a new milestone: 56.4% of online transactions took place through a smartphone during the 2025 holiday season, up from 54.5% in 2024. — Adobe
The 1.9 percentage point increase over 2024 confirms a steady upward trajectory. Mobile isn't the alternative shopping channel anymore. It's the primary one. Desktop still converts at higher rates, but sheer volume has tipped toward phones.
What to do: Audit your mobile checkout flow end-to-end. Eliminate unnecessary form fields, enable autofill for payment and shipping details, and verify that your New Year marketing campaigns are designed mobile-first rather than adapted from desktop layouts.
Desktop Conversion Still Outpaces Mobile
During the 2024 holiday season, the desktop conversion rate on Cyber Monday reached 7%, while mobile conversion sat at around 4.6%. — Statista
This gap has persisted for years. Mobile gets the traffic. Desktop gets the conversions. The point difference represents billions in unrealized mobile revenue across the industry.
What to do: Identify where mobile shoppers drop off in your funnel. Common friction points include slow-loading product images, checkout forms not optimized for thumb input, and surprise shipping costs revealed late in the process.
How Is AI Changing Holiday Shopping Behavior?
Artificial intelligence went from a novelty to a measurable revenue driver during the 2025 holiday season. From product discovery to personalized recommendations, AI tools reshaped how consumers found and bought gifts.

693% Increase in AI-Driven Traffic to Retail Sites
Generative AI tools drove a 693.4% increase in traffic to retail sites during the 2025 holiday season. — Adobe Analytics
A nearly 7x increase in a single year is remarkable, even from a small base. Consumers are using ChatGPT, Google's AI features, and similar tools for product research and gift recommendations. These visitors tend to arrive with higher intent because they've already refined their needs through conversation.
What to do: Optimize your product pages for AI crawlability. Use structured data, clear product descriptions, and FAQ sections that AI tools can parse and surface in conversational results.
AI and Agents Drove $262 Billion in Holiday Revenue
AI and agents accounted for $262 billion of 2025 holiday spend, fueled by personalized recommendations and deeper personal shopping experiences. — Salesforce
That $262 billion figure includes revenue influenced by AI-powered product recommendations, dynamic pricing, personalized email campaigns, and chatbot-assisted purchases. It doesn't mean AI replaced human decision-making. It means AI tools nudged consumers toward products they were already inclined to buy.
What to do: If you're not using AI-powered product recommendations on your site, you're leaving money on the table. Start with basic "frequently bought together" and "similar items" widgets, then test personalized homepage content based on browsing history.
Millennials Most Open to AI-Assisted Holiday Shopping
Millennials had the biggest jump in AI adoption for holiday planning: 37% said they'd use AI tools in 2025, up from 26% in 2024. — Epsilon
The 11-point year-over-year increase among Millennials outpaced every other generation. This demographic, now ages 29-44, combines digital fluency with significant purchasing power. They're using AI for gift ideas, price comparisons, and product research.
What to do: Create content that AI tools can easily reference. Product comparison pages, gift guides organized by recipient type, and "best gifts under $50" posts feed directly into AI-generated recommendations that Millennial shoppers are increasingly relying on.
Gen Z Shopping on Shein and Temu for Gifts
43% of Gen Z expected to shop on Shein for holiday gifts, and 26% planned to use Temu. — Tinuiti
The appeal of ultra-low prices on fast-fashion and general merchandise platforms is strongest among the youngest shoppers. Gen Z's comfort with these platforms reflects different brand loyalty patterns than older generations.
What to do: If you compete with low-cost platforms, don't try to match their prices. Instead, differentiate on quality, delivery speed, return policies, and brand storytelling. Highlight what budget platforms can't offer: fast shipping, easy returns, and products you can see before you buy.
What Are the Key Holiday Retail Sector Statistics?
Not every retail category performed equally during the 2025 holidays. Some sectors surged while others flatlined or declined. These Christmas shopping trends by sector help marketing teams understand where the growth came from and where it didn't.

Groceries Led Online Category Growth at 10.2%
Online grocery sales reached $23.7 billion during the 2025 holiday season, up 10.2%, making it the highest-growth e-commerce category year-over-year. — Forbes
Groceries have been the fastest-growing online holiday category for three consecutive years now. Holiday meal prep, gift baskets, and specialty food items drive this surge. The convenience factor of online grocery ordering for busy holiday hosts can't be overstated.
What to do: If you sell food or beverage products, build dedicated holiday landing pages by early October. Bundle products into gift-ready packages and offer holiday-specific promotions through Christmas marketing campaigns.
Clothing and Accessories Up 6.11% Year-Over-Year
Clothing and accessories store sales increased 2.05% month over month and 6.11% year over year (unadjusted). — NRF Retail Monitor
Fashion and apparel remain one of the strongest holiday categories. The 6.11% year-over-year growth outpaced overall retail growth, suggesting that consumers prioritized clothing gifts.
What to do: Apparel brands should front-load gift card promotions alongside physical product sales. Gift cards reduce return rates and bring recipients back to your store post-holiday, extending the revenue cycle into January.
Electronics and Appliances Dipped 0.4% in December
Electronics and appliance stores saw a 0.4% decline in December, alongside declines in furniture (0.9%) and clothing store sales (0.7%). — CNBC
The December dip in electronics is notable because it follows years of steady growth in that category. Consumer electronics may be reaching a saturation point for holiday gifting, or buyers are front-loading purchases to Black Friday and Cyber Monday deals earlier in the season.
What to do: Electronics retailers should shift promotional emphasis to November and avoid relying on December momentum. Consider January "new year, new gear" campaigns to capture delayed purchase intent.
80% of Shoppers Plan to Spend $100+ on Christmas
Thanksgiving, Hanukkah, and Christmas have the highest expected spend, with 80% of shoppers planning to spend $100 or more on Christmas. — Numerator
Christmas dominates holiday spending by a wide margin. The $100+ threshold for 80% of shoppers means that most consumers are buying multiple gifts or investing in higher-priced items. Hanukkah and Thanksgiving spending tends to be more experience- and food-focused.
What to do: Tailor your product recommendations based on gift value tiers. Prominently feature products in the $25-$150 range, which captures the sweet spot for multiple-gift shoppers working within that $100+ per-holiday budget.
What Does the 2026 Holiday Shopping Forecast Look Like?
Looking ahead to the 2026 holiday season, early forecasts point to continued growth but at a measured pace. Economic uncertainty, tariff concerns, and evolving consumer preferences all factor into the projections. These forward-looking holiday statistics help marketers plan ahead.
2026 Growth Expected to Mirror 2025: ~2.6% Retail, ~6.6% E-commerce
The 2026 holiday season is expected to see similar growth rates to 2025: approximately 2.6% for overall U.S. retail and 6.6% for e-commerce. — eMarketer
E-commerce continuing to outgrow total retail by roughly 4 percentage points reinforces the long-term channel shift. For brands that haven't invested in their online presence yet, the gap between online and offline growth rates should be the wake-up call.
What to do: Allocate at least 60% of your holiday marketing budget to digital channels for 2026. If you currently split evenly between online and offline marketing, the growth data supports a meaningful shift toward e-commerce investment.
Deloitte Forecasts Slower Growth at 2.9%-3.4%
Deloitte forecast holiday sales growth of 2.9% to 3.4%, the slowest pace in years and below last year's 4.2%. — Avison Young (citing Deloitte)
Deloitte's more conservative estimate reflects concerns about consumer debt levels, potential interest rate impacts, and general economic uncertainty. When Deloitte and NRF diverge in their forecasts, the truth usually lands somewhere in between.
What to do: Build your holiday plan with a base scenario (3% growth) and an upside scenario (4%+ growth). Keep flexible inventory and ad budget reserves that you can deploy if early-season results exceed the conservative forecast.
Circana Projects Growth Between -1% and +2%
Circana projects that holiday spending will land somewhere between a 1% decline and 2% growth in dollars. — Circana
Circana's range is the widest among major forecasters, reflecting genuine uncertainty about consumer sentiment heading into 2026. A potential 1% decline would mark the first real pullback in holiday spending since 2009.
What to do: Hedge your bets by diversifying promotional strategies. Don't rely solely on discounts; add value through free shipping thresholds, loyalty points multipliers, and exclusive product drops that create urgency without eroding margins.
NRF Expects 265,000 to 365,000 Seasonal Hires
NRF expects retailers to hire between 265,000 and 365,000 seasonal workers for the 2025-2026 holiday period. — NRF
Seasonal hiring is a leading indicator of retailer confidence. The wide 100,000-person range reflects how uncertain the labor market outlook is. Retailers are hedging between lean operations and the need to staff up for anticipated demand.
What to do: Plan your seasonal hiring by September at the latest. Retailers who recruit early get better candidates. If you run an e-commerce operation, "seasonal hires" might mean temporary customer support agents, fulfillment staff, or freelance content creators for holiday campaigns.
What Happened With In-Store vs. Online Holiday Sales?
The in-store versus online debate continues to shift, but 2025 data shows it's not a zero-sum game. Both channels grew, with consumers often using one to support the other. These holiday retail sales statistics break down how shoppers split their time and money.

December Retail Sales Were Flat, Missing Expectations
Retail sales were flat in December 2025 following a 0.6% increase in November. Economists surveyed by Dow Jones had expected a 0.4% increase. — CNBC
The flat December reading was a surprise, particularly after strong November numbers. The data suggests that consumers pulled forward purchases to November sales events, leaving December without the usual last-minute surge in certain categories.
What to do: If your December sales underperformed relative to November, test extending your Black Friday and Cyber Monday promotions deeper into December next year. The pull-forward effect means December shoppers may need a fresh reason to buy.
Annual Sales Rose 2.4%, Trailing Inflation at 2.7%
On an annual basis, retail sales rose 2.4%, failing to keep up with inflation, as the consumer price index for December posted a 2.7% increase. — CNBC
When sales growth trails inflation, it means consumers bought less stuff in real terms even though they spent more dollars. This distinction matters for inventory planning: unit volumes may have actually declined despite higher revenue.
What to do: Track your holiday metrics in both dollar terms and unit terms. If your average order value went up but order count went down, your growth may be price-driven rather than demand-driven. Adjust inventory forecasts accordingly.
What Do Expert Forecasters Say About Holiday Consumer Sentiment?
Behind every spending statistic is a consumer mindset shaped by economic conditions, media narratives, and personal financial situations. Expert commentary from industry leaders adds context that raw numbers can't capture. Here's what the analysts observed.
A "K-Shaped Economy" With Split Spending Patterns
"This is a K-shaped economy with strong spending from the top and much more cautious spending from middle- and lower-income consumers." — Heather Long, Chief Economist, Navy Federal Credit Union (via CNBC)
Long's observation explains why overall spending numbers look healthy while many individual consumers feel stretched. The top 20% of earners drive a disproportionate share of holiday spending, masking the caution exhibited by middle-income households.
What to do: Segment your holiday campaigns by customer value. High-value shoppers respond to exclusivity and premium products. Budget-conscious shoppers need clear value propositions, payment plans, and buy-now-pay-later options.
Consumers Prioritized Spending on Family and Friends
"December Retail Monitor data saw a sharp surge in growth as consumers continued prioritizing holiday spending on family and friends." — Matthew Shay, NRF President and CEO (via Just Style)
Shay's comment points to the emotional driver behind holiday spending resilience. Even when budgets tighten, gifts for loved ones remain non-negotiable for most consumers. This emotional anchor is what makes holiday spending resistant to pullbacks.
What to do: Frame your holiday marketing around relationships rather than transactions. "Find the right gift for your sister" performs better than "20% off everything" because it taps into the emotional motivation that drives holiday purchases.
Retailers Prepared to Deliver on Deals and Value
"With more consumers planning to seek out sale events this year, retailers are prepared to deliver on deals and value to ensure consumers have everything they need to make the holiday special." — Katherine Cullen, NRF Vice President of Industry and Consumer Insights (via NRF)
Cullen's statement signals that retailers anticipated deal-seeking behavior and planned their promotional strategies around it. Competition for holiday deals has intensified as more retailers match Black Friday prices across the entire November-December window.
What to do: Don't wait for shoppers to find your deals. Push promotions through email, SMS, and on-site popups. According to our experience at Popupsmart, targeted holiday popups with countdown timers can increase Black Friday conversion rates by surfacing your best offers at the moment of highest purchase intent.
Generative AI Embraced as a Shopping Assistant
"This 2025 holiday season, consumers embraced generative AI more than ever as a shopping assistant in their purchasing decisions." — Vivek Pandya, Lead Analyst, Adobe Digital Insights (via Adobe)
Pandya's comment underscores a behavioral shift: AI isn't just a backend tool for retailers. Consumers are actively using it as a front-end shopping assistant. Product research, gift suggestions, and price comparisons now happen through conversational AI interfaces.
What to do: Make your product information AI-friendly. Write clear, specific product descriptions with quantifiable features. Include FAQ sections on product pages. The more structured your content, the more likely AI tools are to recommend your products when shoppers ask for suggestions.
What Are the Holiday Shopping Statistics for Key Shopping Days?
Specific shopping days during the holiday season generate concentrated bursts of consumer activity. Tracking their individual performance helps marketing teams allocate budget and resources. These day-by-day statistics reveal where the spending peaks fell.

Cyber 5 Remained the Dominant Shopping Window
The five-day Thanksgiving-through-Cyber Monday period continued to concentrate a disproportionate share of holiday spending. With 202.9 million shoppers participating, the Cyber 5 generates more transaction volume per day than any other period of the year. Retailers who prepared their Cyber Monday marketing strategies saw the strongest returns during this compressed window.
What Should Marketers Do With These Holiday Shopping Statistics?
These statistics were compiled from 20+ primary sources including NRF, Deloitte, PwC, Adobe Digital Insights, Salesforce, Gallup, Accenture, eMarketer, and others. Each data point was traced to its original publication and cross-referenced against at least one additional outlet. Where sources disagreed on projections (e.g., NRF vs. Deloitte on growth rates), we presented both with context. Statistics from 2022 or earlier are labeled with their data year.
Three patterns define this year's data. Spending keeps rising — a record $257.8 billion online and average budgets above $890 confirm consumers treat holiday spending as non-negotiable even under inflation. Mobile and AI are now the default shopping infrastructure, with 56.4% of transactions on smartphones and AI-driven traffic up 693%. And the season keeps stretching — 45% of shoppers start before November, and Super Saturday now rivals Black Friday in total shoppers.
For 2026 planning, these numbers are blueprints: start earlier, optimize for mobile, make your product data AI-ready, and segment between deal-seekers and premium buyers. Tools like a marketing holiday calendar keep your promotional schedule organized, while Popupsmart's no-code popup builder helps you surface the right offer at the right moment.
Frequently Asked Questions

What sells most during Christmas?
Groceries were the fastest-growing online category during the 2025 holidays, with $23.7 billion in sales and 10.2% year-over-year growth according to Forbes. Clothing and accessories grew 6.11% year-over-year per NRF data. Traditionally strong gift categories like electronics, toys, and gift cards remained popular, though electronics saw a 0.4% December decline (CNBC). According to Numerator, 80% of Christmas shoppers planned to spend $100 or more, with gifts for family members driving the largest share of spending.
What's the busiest Christmas shopping day of the year?
The Thanksgiving-through-Cyber Monday weekend attracted a record 202.9 million shoppers in 2025 (Zeta Global), making it the busiest concentrated shopping period. However, NRF predicted 159 million shoppers would turn out for Super Saturday (the last Saturday before Christmas), making it one of the single biggest individual shopping days. Black Friday and Cyber Monday continue to compete for the top spot depending on whether you measure foot traffic, online transactions, or total dollar volume.
What is the psychology of holiday shopping?
Holiday shopping behavior is driven by emotional and social obligations more than rational price calculations. According to NRF, 91% of U.S. adults participate in winter holiday celebrations, creating a near-universal expectation to give gifts. The "K-shaped" spending pattern identified by Navy Federal's Heather Long shows that higher-income consumers spend freely while middle-income shoppers hunt aggressively for deals (with 69% engaging in deal-seeking per Bread Financial). Early shopping (45% start before November per Porch Group Media) reflects anxiety about availability and budget management rather than excitement.
What are predicted holiday trends for 2026?
According to eMarketer, the 2026 holiday season should see approximately 2.6% overall retail growth and 6.6% e-commerce growth, roughly matching 2025 rates. Deloitte forecasts a more conservative 2.9% to 3.4%, and Circana's range extends from a 1% decline to 2% growth. The key variables include consumer debt levels, potential tariff impacts, and the continued expansion of AI-driven shopping tools. Retailers should plan for steady but not spectacular growth, with online channels continuing to outpace physical retail.

How would you rate your experience with this article? 😊