How to See Your Campaign Metrics
Maximize your campaign impact. Learn to access your campaign metrics on Popupsmart to refine your approach for optimal results.
During your Popupsmart journey, you will come across terms like popup views, leads, interaction, and conversion rate.
Follow this guide to keep track of your popup campaign metrics.
First off, there are three ways to see the analytics of each campaign on your Popupsmart dashboard.
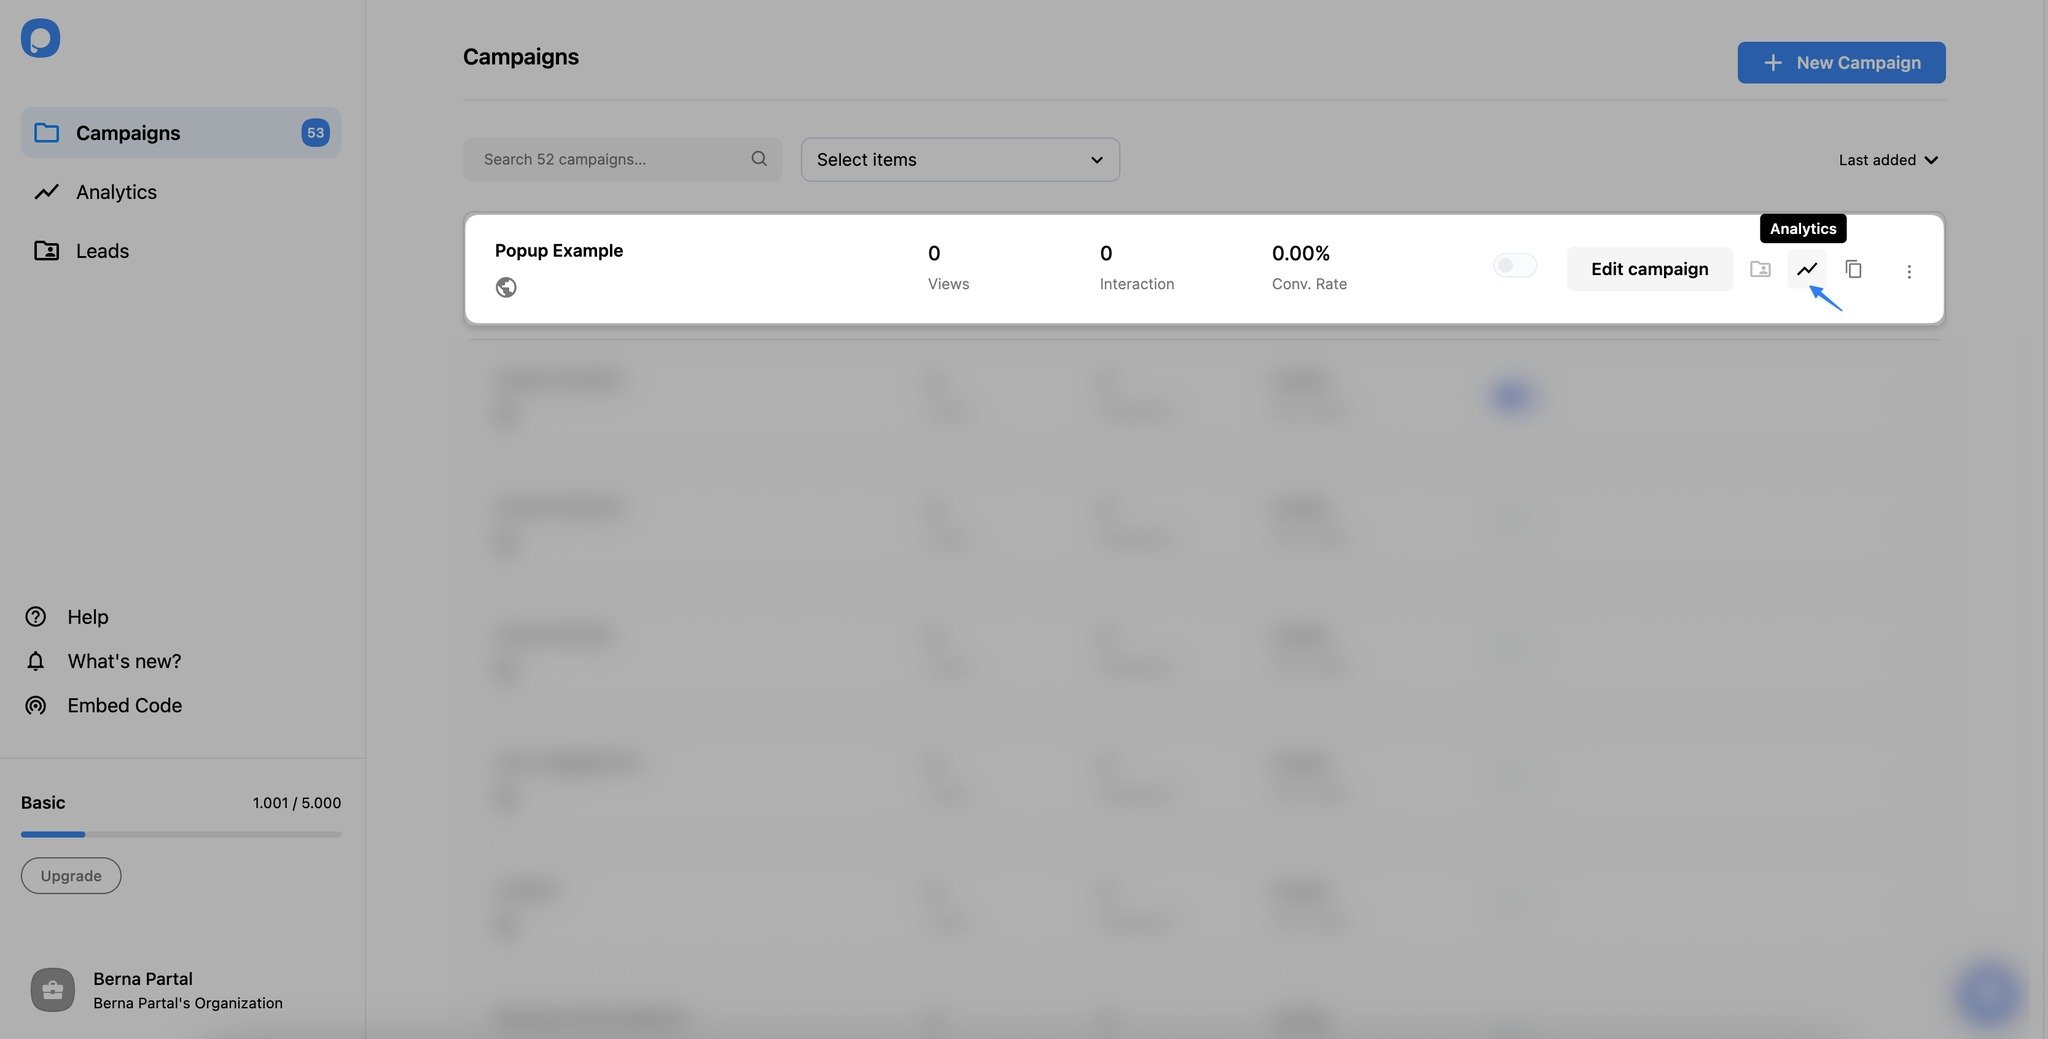
1. On the “Campaigns” page, just click on the analytics icon on your campaign as shown below, and it will open the selected campaign analytics window.
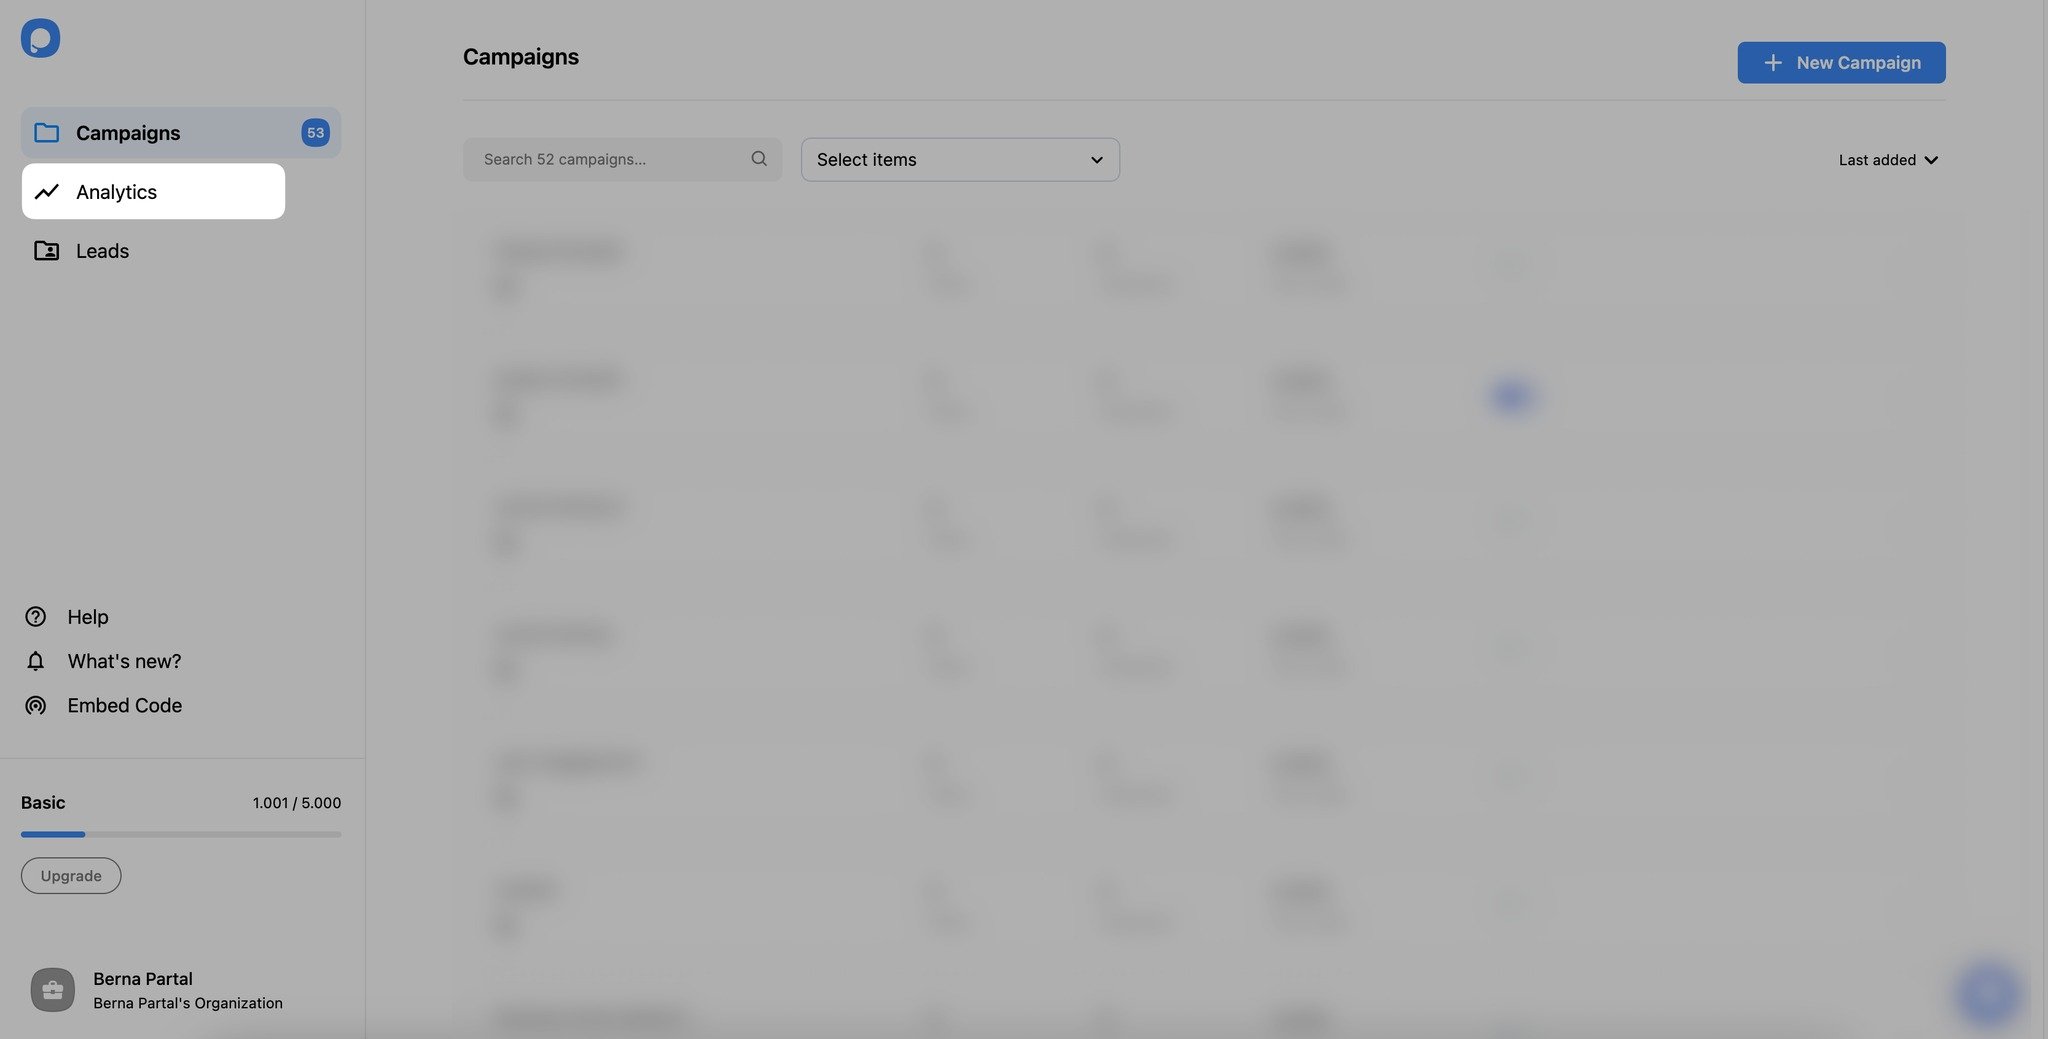
2. From your popup campaign, you can see the “Analytics” and “Leads” icons will appear once you publish your popup, as shown below.
![]()
3. The last one is going to the “Analytics” screen directly. You can easily access detailed campaign statistics by clicking the "Analytics" tab on the left menu in your Dashboard to see the performance of your campaigns.
How does the Popupsmart Analytics Work?
Popupsmart’s Analytics page provides you with a better understanding of your campaigns’ performance.
See how it works quickly:
1. Choose your campaign from the drop-down area at the top of the Analytics page for which campaign you want to see the data.
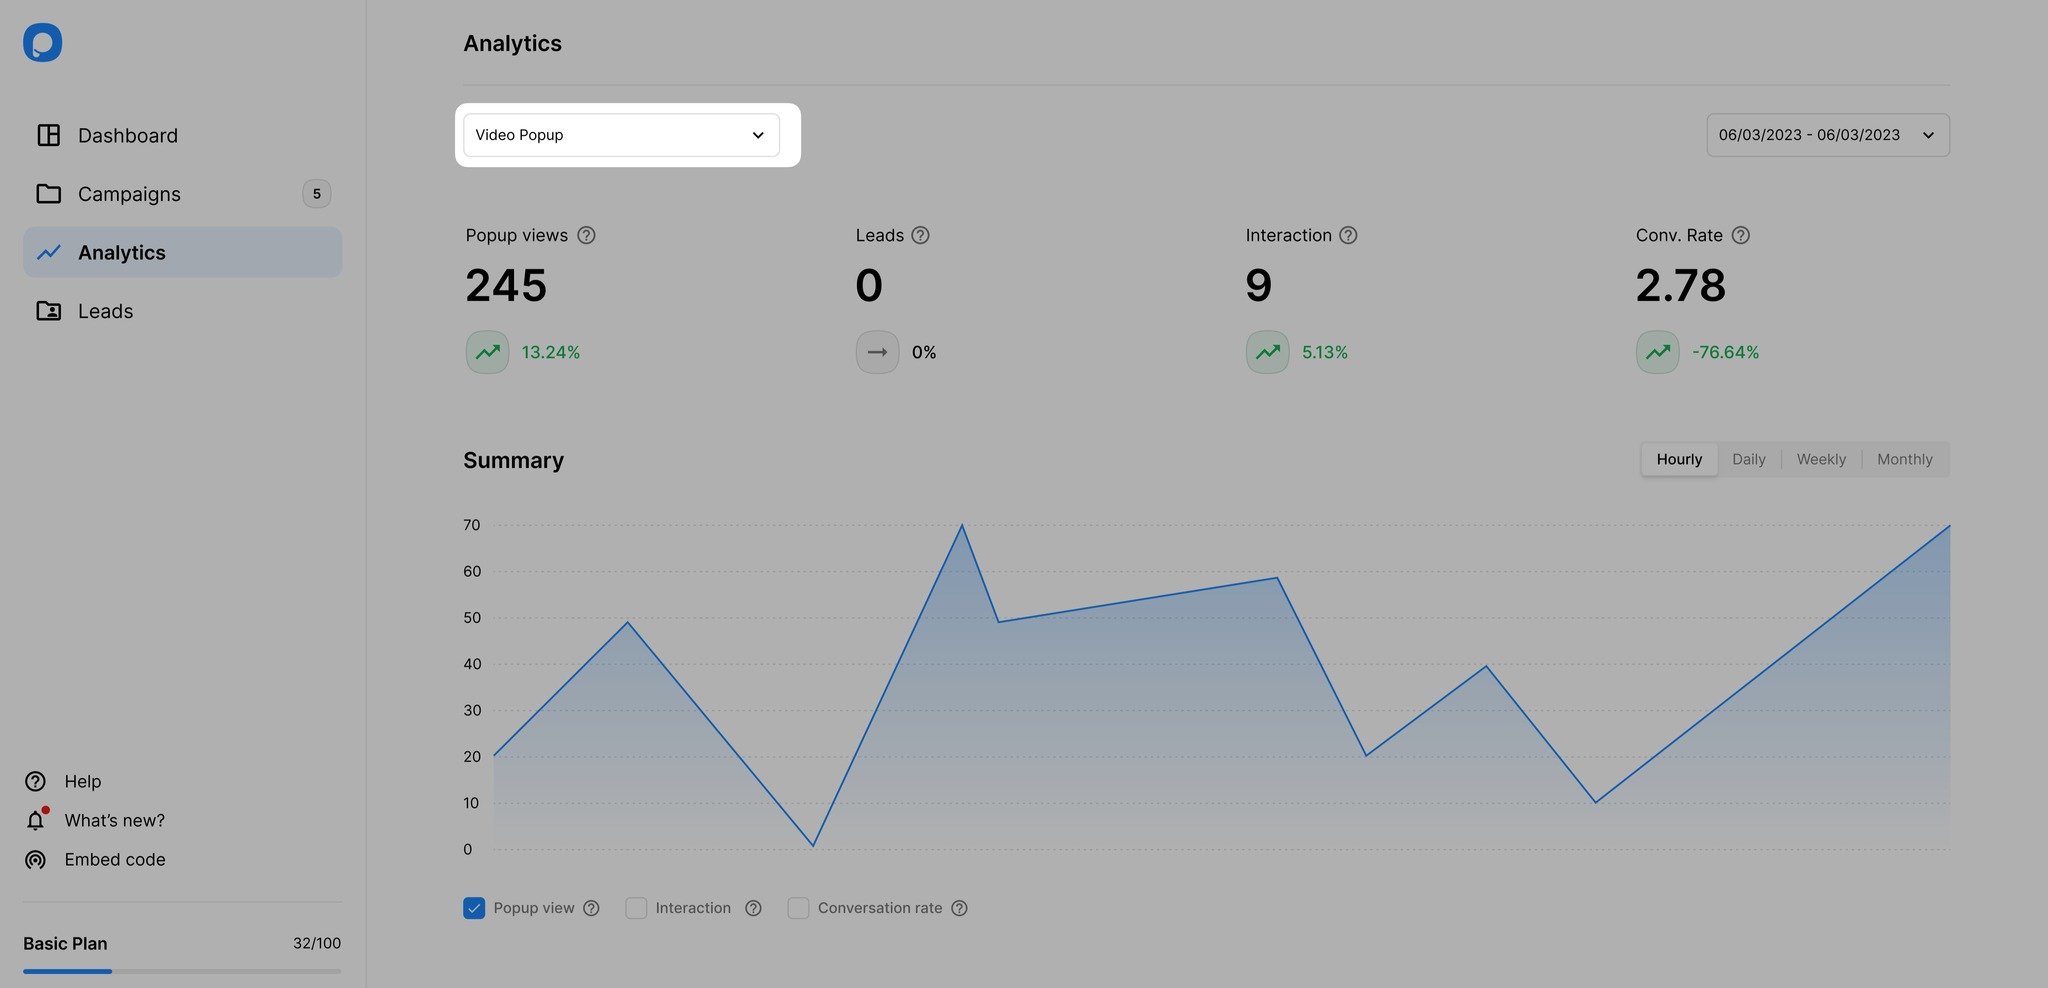
2. Campaign Analytics reflects the results of the selected date range. To select a date range, click on the “Date” top of the Analytics page and select the start and end dates.
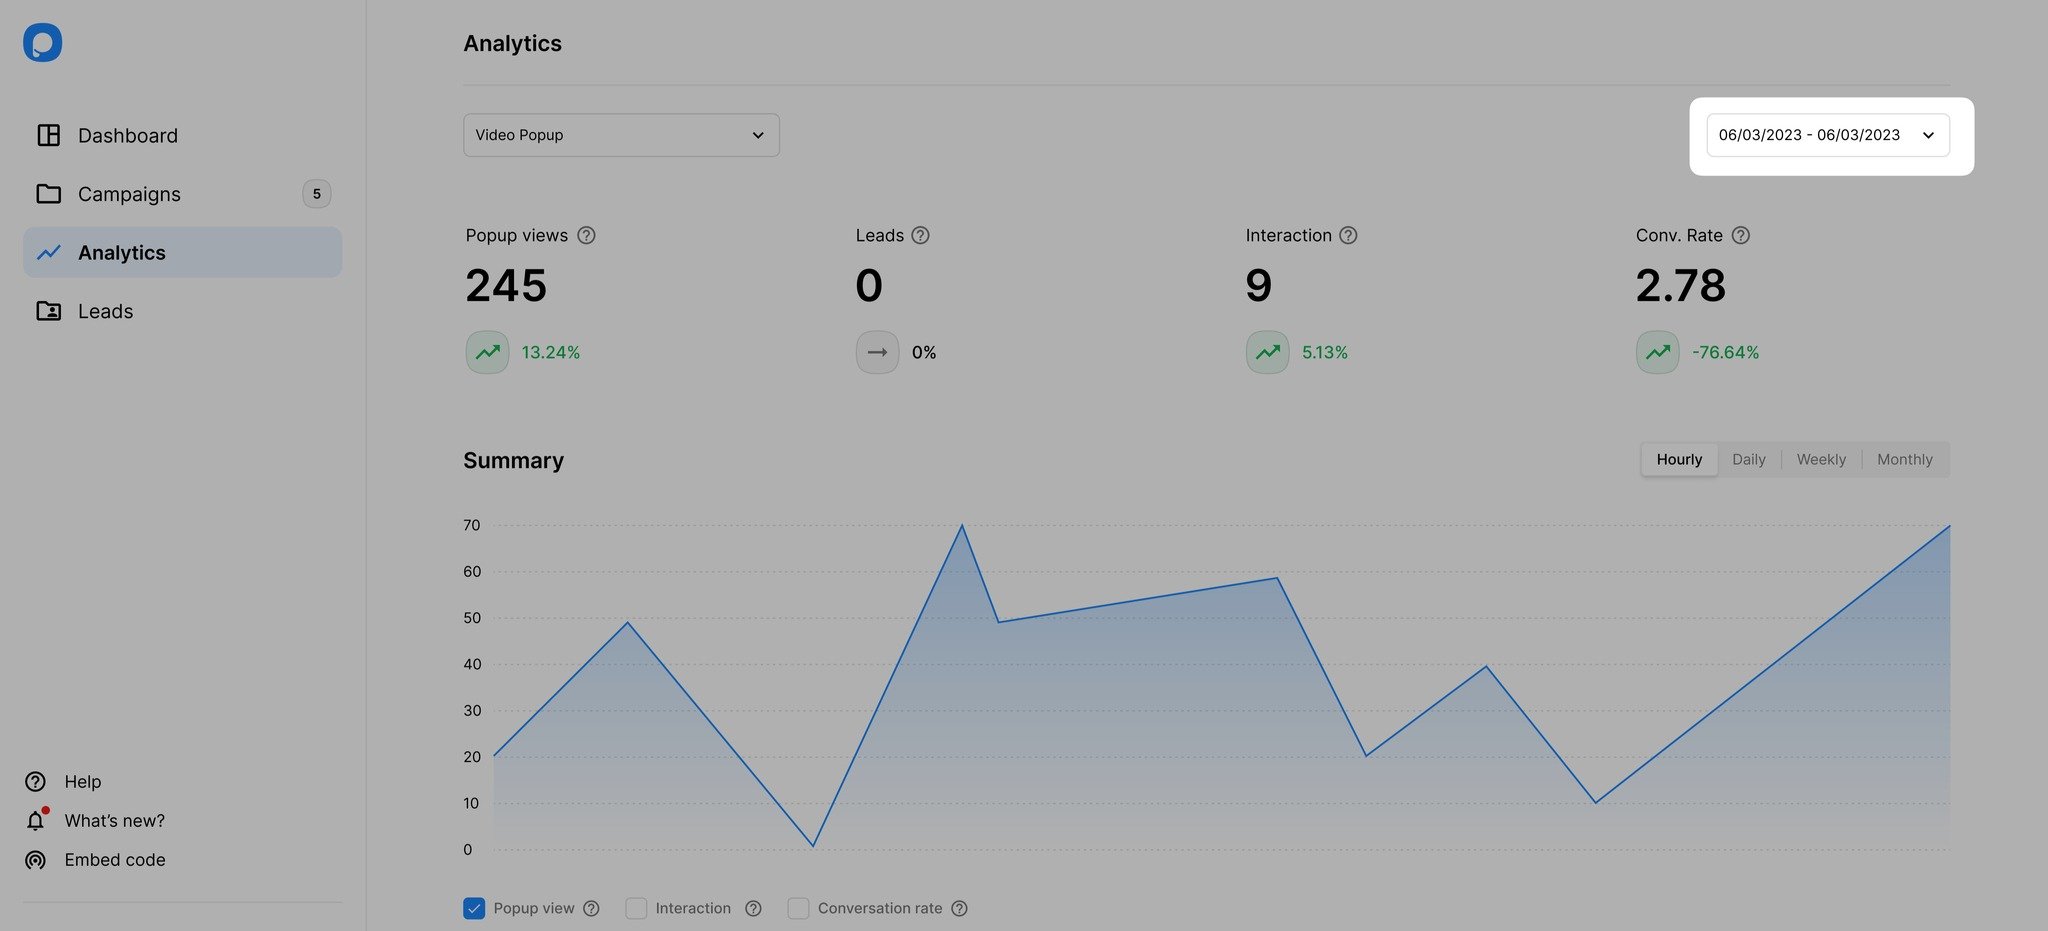
You can see daily, weekly, and monthly summary data of your popup campaigns.
3. Also, you can get an overview of where your visitors are from, referrers, and what pages your users visit at the bottom of the page.
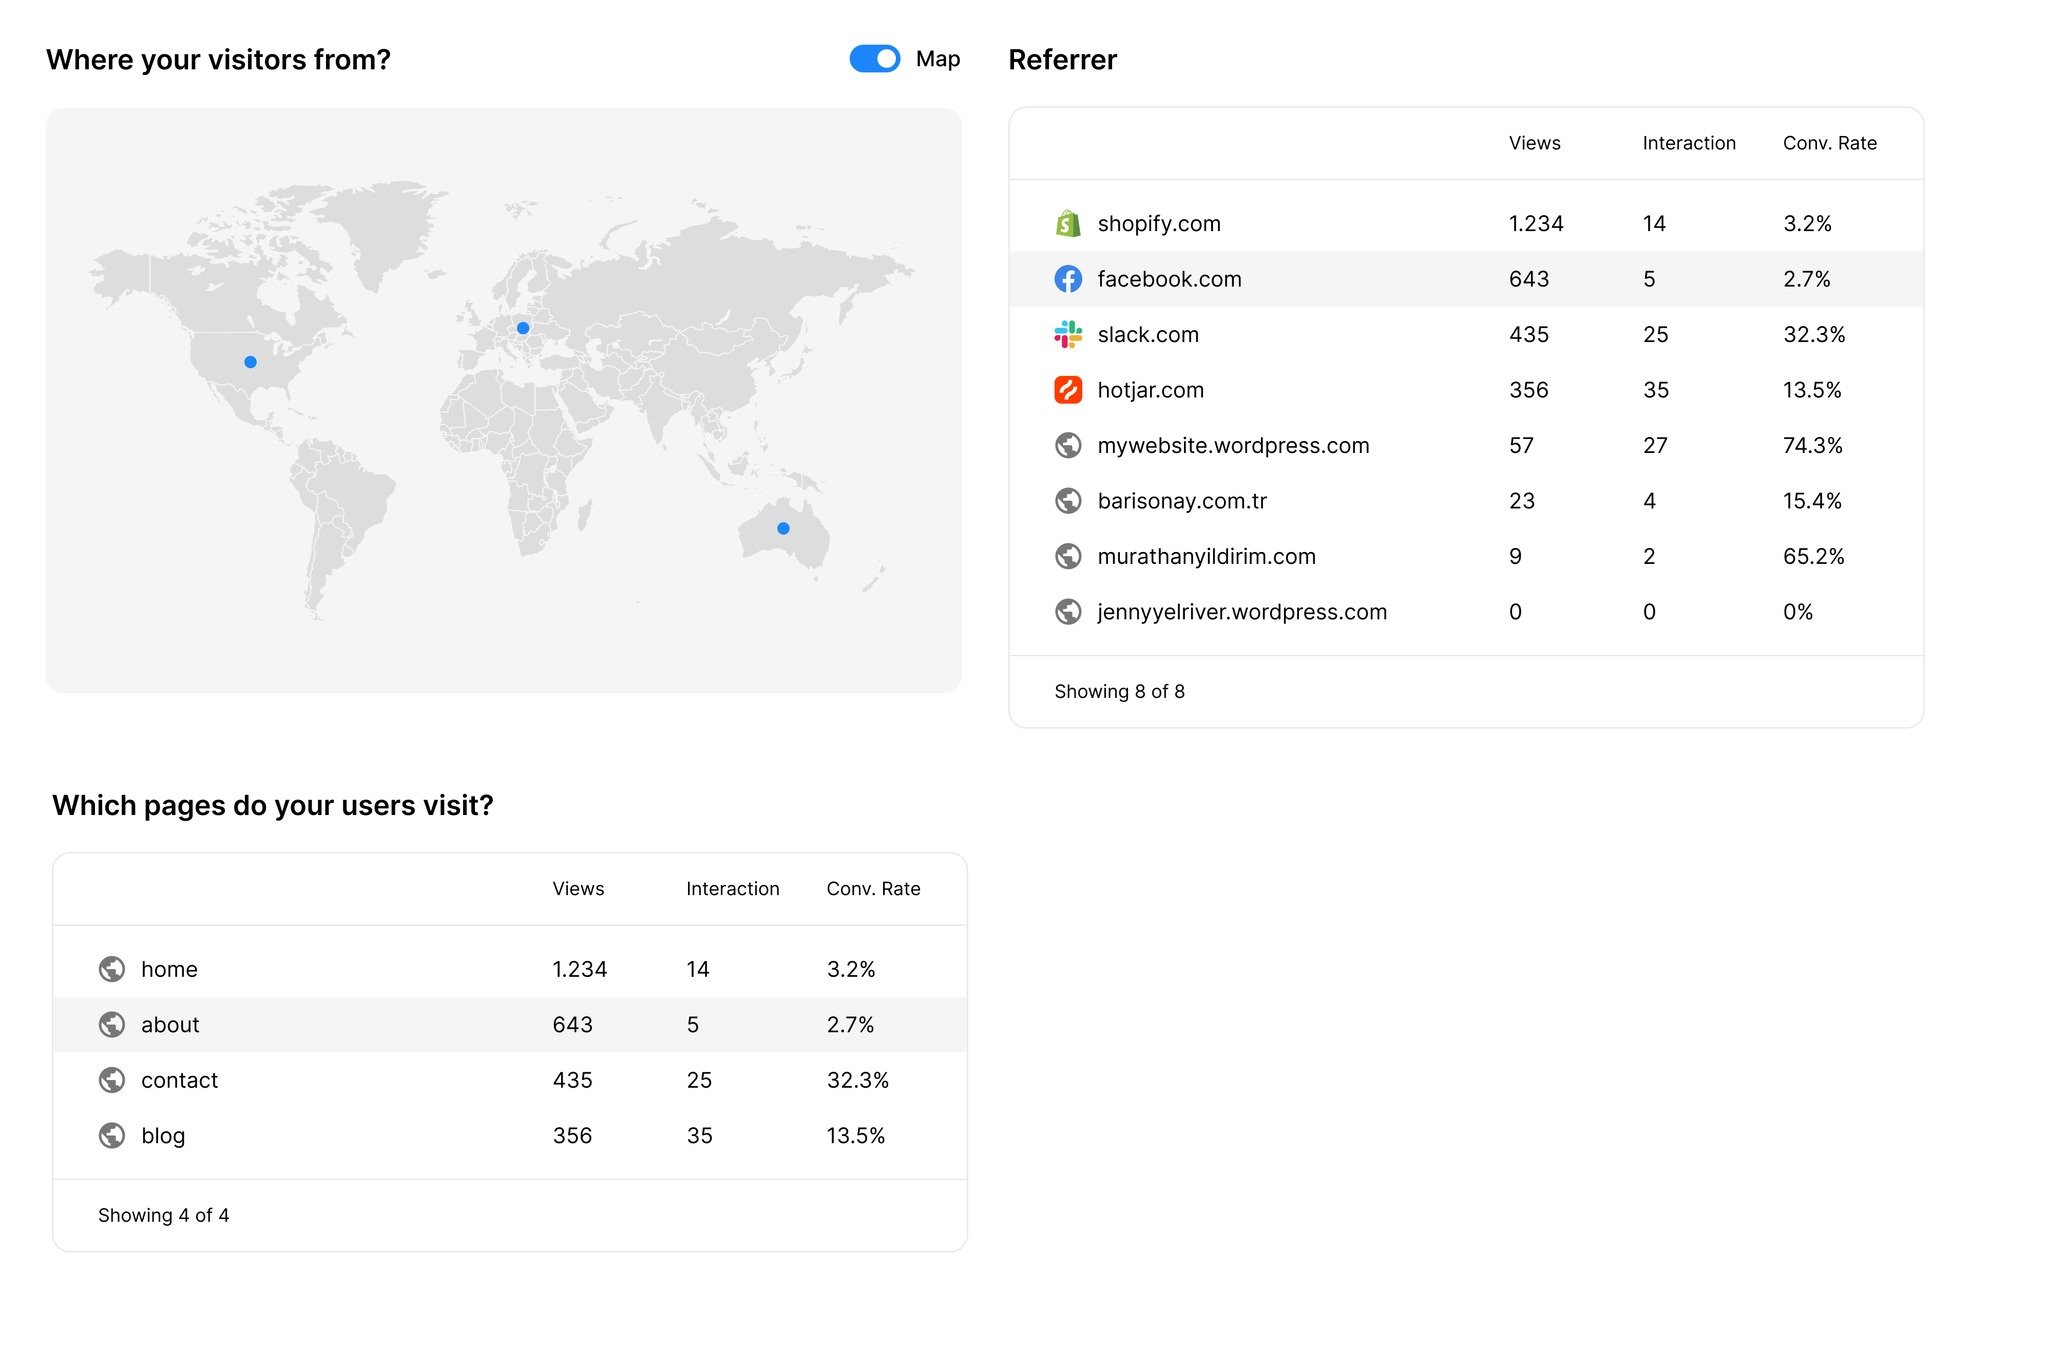
You can use these metrics to improve your next campaigns, generate more detailed campaign reports, and gain powerful insights.
Have further questions? Feel free to contact us!
How is this guide?