13 Key Funnel Metrics for Growth in 2026
Funnel metrics track the customer journey through a conversion/sales funnel (AIDA) to find drop-offs, improve experience, and optimize ROI. Key metrics include leads, conversion rate, CAC, sales velocity, deal/AOV, engagement/CSAT, repeat rate, abandonment, CLV, ROI, and churn.
If you're a business owner or marketer, monitoring funnel metrics is crucial.
Funnel metrics are the quantitative checkpoints that track how prospects move from first touch to paying customer. These 13 metrics expose where deals stall, which channels waste budget, and what drives repeatable revenue. This guide breaks down each metric with formulas, benchmarks, and implementation steps so you can start optimizing your funnel today.
Summary of all 13 funnel metrics:
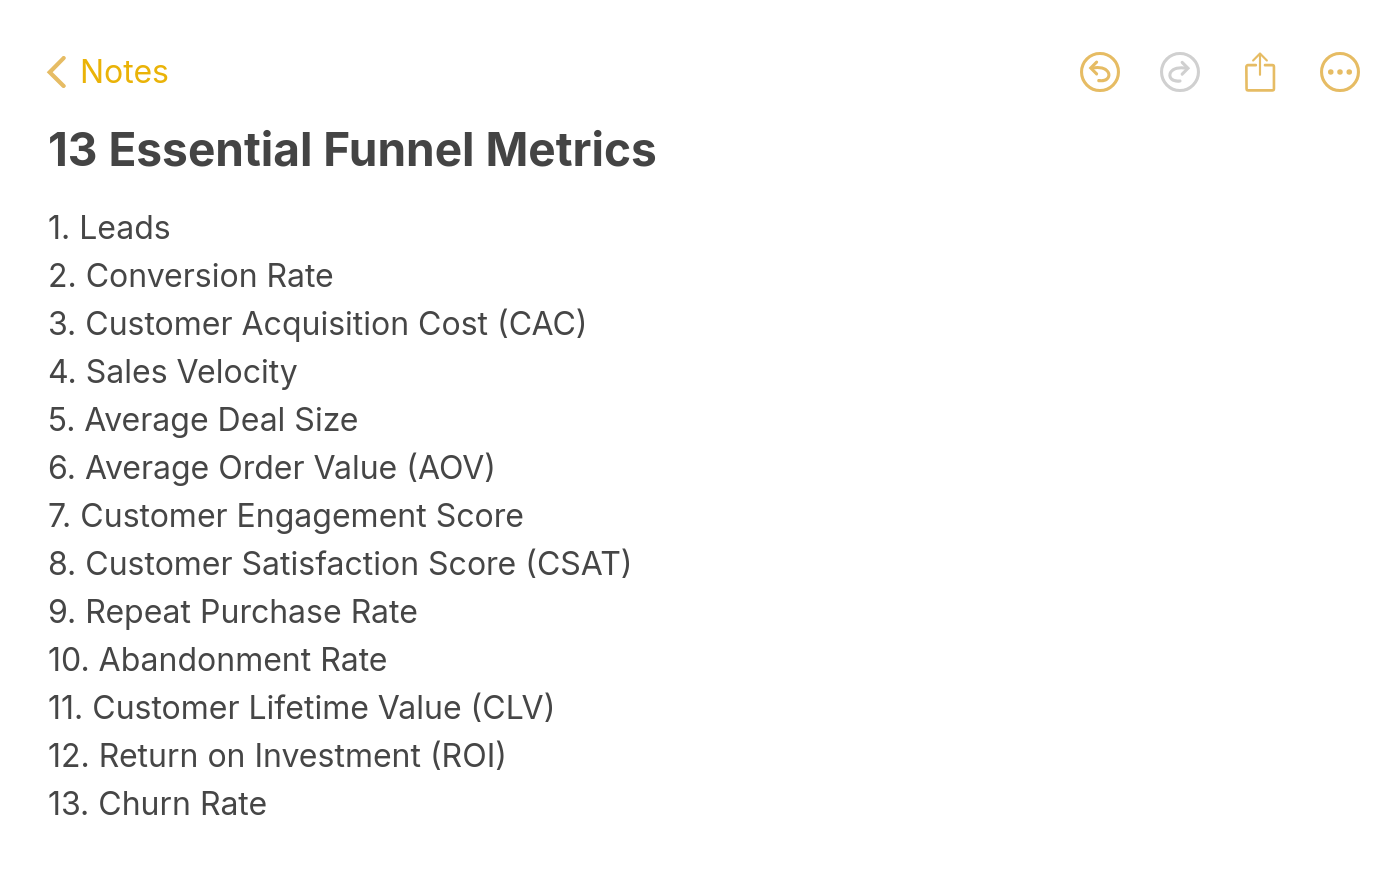
The 13 essential funnel metrics every B2B team should track
1. Number of Leads: Measure pipeline volume and identify your highest-performing acquisition channels
2. Conversion Rate: Track the percentage of visitors completing desired actions at each funnel stage
3. Customer Acquisition Cost (CAC): Calculate spending efficiency per new customer acquired
4. Sales Velocity: Quantify how fast revenue moves through your pipeline
5. Average Deal Size: Monitor revenue per closed deal to guide pricing and upsell strategy
6. Average Order Value (AOV): Increase per-transaction revenue through bundling and cross-selling
7. Customer Engagement Score: Score product usage patterns to predict retention and expansion
8. Customer Satisfaction Score (CSAT): Collect direct feedback to reduce churn before it happens
9. Repeat Purchase Rate: Gauge loyalty by tracking multi-purchase customers
10. Cart Abandonment Rate: Recover lost revenue from incomplete checkout flows
11. Customer Lifetime Value (CLV): Project total revenue per customer to inform acquisition budgets
12. Return on Investment (ROI): Measure net profitability of marketing and sales spend
13. Churn Rate: Track customer loss to prioritize retention efforts
What Are Funnel Metrics and Why Do They Matter?
Funnel metrics are measurements that quantify your prospect's journey from awareness through purchase and beyond. They map directly to the stages of your conversion funnel (sometimes called the AIDA model): Awareness, Interest, Decision, and Action.
What makes them valuable isn't just the individual numbers. It's the story they tell when you look at them together. A high lead count paired with a low conversion rate points to a qualification problem. Strong conversion rates but high churn means your product isn't delivering on what marketing promised.
According to Funnel.io's marketing intelligence research, nearly 70% of companies haven't attempted to measure the effectiveness of their sales and marketing funnels. That gap is an opportunity. Teams that track funnel metrics consistently can spot drop-off points, reallocate budget to high-performing channels, and forecast revenue with accuracy instead of gut instinct.
For B2B SaaS specifically, these metrics matter even more because of longer sales cycles, multiple decision-makers, and recurring revenue models. A single improvement at one funnel stage compounds across every deal that follows.
1. Number of Leads: Your Pipeline's Starting Point
Lead count measures how many prospects enter your funnel through any channel, whether that's organic search, paid ads, referrals, or direct outreach. It's the top-of-funnel metric that sets the ceiling for everything downstream. Without enough leads feeding in, no amount of optimization at later stages will produce meaningful revenue.
What separates useful lead tracking from vanity metrics is segmentation. Raw lead volume doesn't tell you much. Breaking leads down by source, quality tier (MQL vs. SQL), and entry point reveals which channels actually produce pipeline value.
Ways to track this:
1. Set up UTM parameters on every campaign link so you can attribute leads to specific channels in Google Analytics or your CRM
2. Define your lead scoring criteria before you start counting. Assign point values for actions like visiting pricing pages (high intent), downloading a guide (medium intent), and reading a blog post (low intent)
3. Use targeted B2B popups to capture leads at intent-rich moments, such as when visitors spend 30+ seconds on a product page or scroll past 60% of a case study
4. Build a weekly dashboard tracking lead volume by source, cost per lead, and lead-to-MQL conversion rate for each channel
5. Review monthly and cut channels with lead-to-opportunity rates below 2%. Reinvest that budget into your top two performers
According to Martal Group's 2026 sales statistics, 80% of deals require five or more touchpoints before closing. This means your lead capture strategy needs to account for multi-touch nurturing, not just first-contact volume. Teams that track lead source alongside deal velocity can identify which channels produce not just the most leads, but the fastest-closing ones.
2. Conversion Rate: Measuring Effectiveness at Every Stage
Conversion rate is the percentage of people who take a desired action at any given funnel stage. That action could be signing up for a free trial, requesting a demo, upgrading from free to paid, or completing a purchase. It's the single most versatile funnel metric because you can apply it at every transition point.
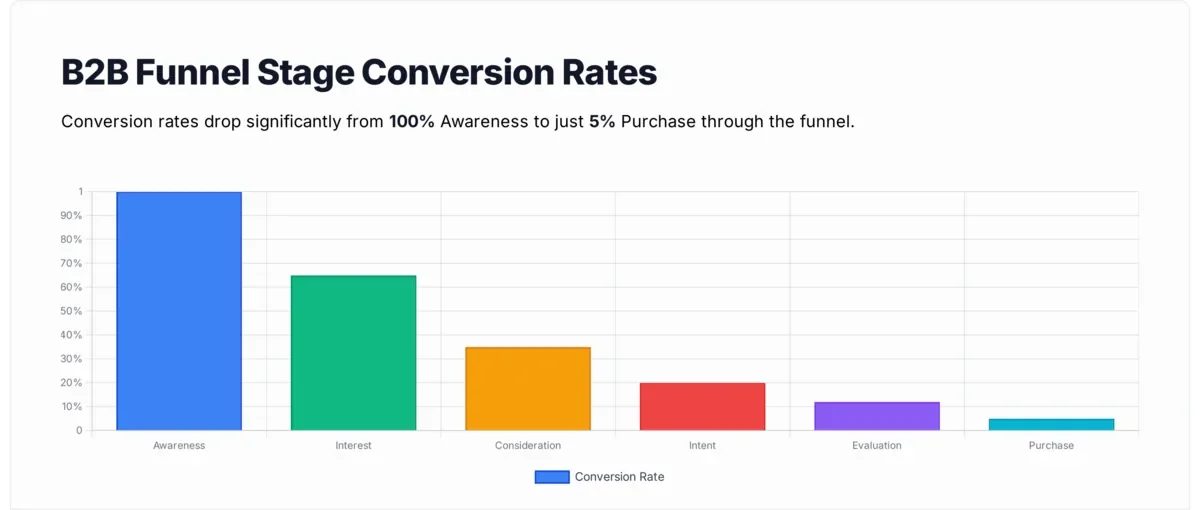
Typical B2B funnel conversion rates decline at each stage
The formula is straightforward: Conversion Rate = (Number of Conversions / Total Visitors) x 100. But the power comes from applying it granularly, not just to your entire site.
How to measure this at every stage:
1. Map your funnel stages explicitly: visitor → lead → MQL → SQL → opportunity → customer. Measure conversion rate at each transition
2. Set up goal tracking in your analytics tool for each stage. In Google Analytics 4, create custom events for trial signups, demo requests, and plan upgrades separately
3. Segment by traffic source. Organic search visitors might convert at 4% while paid social converts at 1.5%, and that gap should drive budget decisions
4. Run split tests on your conversion points. Test one variable at a time: headline, CTA button color, form field count, or offer type
5. Benchmark against your industry. A good conversion rate varies widely, but aim to beat your own baseline by 10-15% each quarter
According to VWO's conversion rate analysis, most sales funnels convert between 3% and 10%, though B2B funnels typically fall between 1% and 5% due to longer buying cycles. If your overall funnel conversion sits below 3%, the bottleneck is likely between MQL and SQL stages, where qualification criteria either let too many weak leads through or filter out viable prospects.
3. Customer Acquisition Cost (CAC): Spending Efficiency Per Customer
Customer acquisition cost is exactly what it sounds like: the total money you spend to win one new customer. It includes marketing spend, sales team salaries, tools, ad costs, content production, and any other expense tied to acquiring customers.
The formula: CAC = Total Sales and Marketing Costs / Number of New Customers Acquired
What makes CAC tricky is that it varies wildly by channel. Your organic content might have a CAC of $50 while paid search runs at $400. Knowing per-channel CAC lets you invest where the math works.
Steps to calculate this accurately:
1. Calculate blended CAC monthly using total spend across all channels divided by total new customers. This gives you the baseline
2. Break down CAC by channel: separate organic, paid search, paid social, referral, and outbound into individual CAC calculations
3. Include fully loaded costs. Don't forget sales team salaries, tool subscriptions (CRM, analytics, marketing automation), and content production costs
4. Set a CAC payback period target. For SaaS, aim to recover CAC within 12 months through subscription revenue
5. Track the CAC-to-CLV ratio monthly. If it climbs above 1:3, you're spending too much relative to what customers are worth
According to Trackier's acquisition data, the cost to acquire new customers has increased by 222% over the past eight years. This pressure makes CAC tracking non-optional for any growth team. We've found that companies combining organic content with lead generation automation typically cut their blended CAC by 30-40% within two quarters compared to teams relying solely on paid channels.
4. Sales Velocity: How Fast Revenue Moves Through Your Pipeline
Sales velocity measures the speed at which deals generate revenue as they move through your pipeline. It combines four factors into a single number that tells you how much money your team produces per day.
The formula: Sales Velocity = (Number of Opportunities x Average Deal Value x Win Rate) / Length of Sales Cycle
Each variable is a lever. Increasing any one of them (or shortening the sales cycle) directly accelerates revenue. This makes sales velocity useful not just for measurement but for prioritization: which lever gives you the biggest return right now?
How to build this into your pipeline:
1. Pull the four inputs from your CRM. Most platforms (HubSpot, Salesforce, Pipedrive) can generate these automatically if your pipeline stages are configured
2. Calculate weekly and compare trends over 90-day rolling windows. Short-term fluctuations are noise; the trend line is the signal
3. Identify your weakest lever. If your win rate is 20% but your deal value is strong, invest in sales enablement. If deal value is low, focus on upselling and packaging
4. Shorten the sales cycle by automating repetitive tasks: proposal generation, contract routing, follow-up sequences. Each day removed from the cycle directly increases velocity
5. Segment by deal source. Inbound leads often have 40-60% shorter sales cycles than outbound because they arrive with existing intent
According to Martal Group's research, sales reps spend only 28% of their time actually selling. The remaining 72% goes to admin work, data entry, and internal meetings. Automating even half of that non-selling time can functionally double a rep's pipeline capacity without adding headcount, which directly improves sales velocity.
5. Average Deal Size: Revenue Per Closed Opportunity
Average deal size is the mean revenue generated per closed deal. For SaaS businesses, this typically maps to annual contract value (ACV). It answers a simple question: when you win a deal, how much is it worth?
The formula: Average Deal Size = Total Revenue from Closed Deals / Number of Closed Deals
This metric matters because it directly affects how many deals you need to hit revenue targets. A team closing $5K deals needs 200 wins to reach $1M ARR. A team closing $50K deals needs 20. The go-to-market motion, team structure, and sales process should all align with your target deal size.
How to track and grow this:
1. Track deal size at close, not at proposal stage. Proposals often get negotiated down, and tracking proposal value inflates the metric
2. Segment by customer type: SMB, mid-market, and enterprise. Each segment should have its own benchmark and growth target
3. Implement upsell strategies during the sales process. Bundle complementary features, offer annual prepayment discounts (which increase deal size despite the discount), and position premium tiers early
4. Review pricing quarterly. If your win rate exceeds 40%, your prices may be too low. Test a 10-15% increase on new prospects while keeping existing customer rates unchanged
5. Train sales reps on multi-stakeholder selling. Deals involving three or more decision-makers tend to be 34% larger because they address broader organizational needs
6. Average Order Value (AOV): Revenue Per Transaction
Average order value tracks the mean dollar amount customers spend per transaction. While similar to average deal size, AOV applies more broadly to e-commerce and transactional SaaS models where customers make repeated purchases or add-on buys.
The formula: AOV = Total Revenue / Number of Orders
Increasing AOV is often the fastest path to revenue growth because you're extracting more value from traffic you've already acquired. No additional marketing spend required.
Tactics to move this number:
1. Set a minimum free shipping or free feature threshold just above your current AOV. If your AOV is $45, set free shipping at $59. This nudges customers to add items
2. Create product bundles that offer 10-15% savings versus buying items individually. Position these prominently on product pages and during checkout
3. Add cross-sell recommendations at checkout based on purchase history. "Customers who bought X also added Y" works because it reduces decision friction
4. Use tiered pricing with clear value steps. Show the mid-tier plan as "Most Popular" to anchor buyers above the cheapest option
5. Test popup campaigns that trigger at cart value thresholds. A message like "Add $15 more for free shipping" converts more
7. Customer Engagement Score: Predicting Retention Through Behavior
Customer engagement score quantifies how actively your customers use your product. It's a composite metric that weights different actions (logins, feature usage, support interactions, content consumption) into a single number predicting whether a customer will renew, expand, or churn.
The formula: Customer Engagement Score = (Event A x Weight) + (Event B x Weight) + (Event C x Weight)
You define which events matter and how much. A customer who logs in daily, uses three or more features, and invites team members gets a high score. One who hasn't logged in for 14 days scores low, and that's your churn warning signal.
How to build and use this scoring system:
1. Identify 5-7 key product actions that correlate with retention. For Popupsmart, this might include creating a campaign, setting targeting rules, publishing a popup, and reviewing analytics
2. Assign weights based on retention correlation, not gut feel. Run a regression analysis on your churned vs. retained customers to find which actions actually predict renewal
3. Set score thresholds: Green (high engagement, likely to renew), Yellow (declining, needs outreach), Red (at-risk, immediate intervention). Trigger automated email sequences for Yellow and Red segments
4. Track engagement trends, not just snapshots. A customer scoring 80 today but trending downward from 95 needs attention before they hit 60
5. Feed engagement data into your user engagement optimization strategy. Low-engagement cohorts might benefit from targeted in-app messages or guided onboarding refreshers
According to Funnel.io's State of Marketing Intelligence report, nearly eight in ten marketers say they don't have a clear signal on what's truly working. Customer engagement scoring solves this by connecting product usage data directly to revenue outcomes. Teams that implement scoring typically identify at-risk accounts 30-45 days earlier than those relying on reactive churn indicators like cancellation requests.
8. Customer Satisfaction Score (CSAT): Direct Feedback That Prevents Churn
CSAT measures how satisfied customers are with a specific interaction, product, or overall experience. Unlike NPS (which measures loyalty) or engagement scores (which measure behavior), CSAT captures sentiment at a moment in time through direct survey responses.
The formula: CSAT (%) = (Number of Positive Responses / Total Responses) x 100
A "positive response" is typically a 4 or 5 on a 5-point scale. The simplicity is the strength: customers can answer in two seconds, which means higher response rates than longer surveys.
Collecting and acting on this metric:
1. Deploy CSAT surveys at specific touchpoints: after onboarding, after support tickets close, after feature releases, and at 30/60/90-day intervals
2. Keep surveys to one question (the rating) plus one optional open-text field ("What could we improve?"). Anything longer tanks completion rates
3. Use popup surveys timed to appear after meaningful interactions. A form submission popup triggered 30 seconds after a user completes a key workflow captures sentiment when it's freshest
4. Segment CSAT by customer tier, product plan, and tenure. Enterprise customers on annual plans might score differently than SMBs on monthly billing
5. Close the feedback loop. Respond to every negative CSAT score within 24 hours. Customers who submit low scores and receive a personal follow-up retain at 2x the rate of those who don't
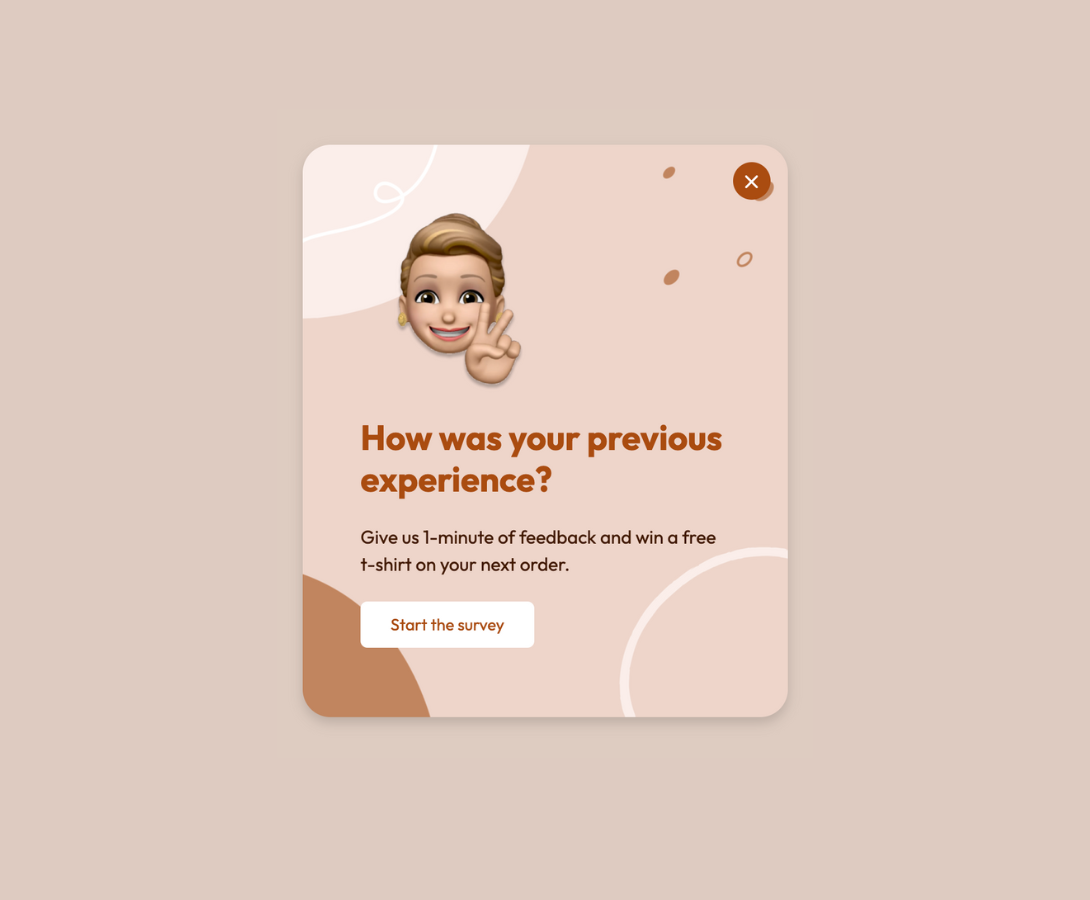
A Popupsmart popup campaign collecting CSAT feedback with a simple rating interface
In my experience running CSAT programs across SaaS products, the open-text responses are more valuable than the scores themselves. A 3-star rating tells you something is wrong. The comment "I couldn't find the export button" tells you exactly what to fix. Teams that act on qualitative CSAT feedback within two weeks see score improvements of 8-12 points within a quarter.
9. Repeat Purchase Rate: Measuring Real Loyalty
Repeat purchase rate is the percentage of customers who come back and buy again. For subscription SaaS, this translates to renewal rate or expansion revenue. For transactional models, it's literal repeat purchases. Either way, it's the clearest indicator of product-market fit after the initial sale.
The formula: Repeat Purchase Rate = Customers Who Purchased More Than Once / Total Unique Customers
A high repeat purchase rate means your product delivers enough value that customers choose to return. A low rate means you're running a leaky bucket: acquiring customers just to lose them.
How to measure and improve this:
1. Define your repeat purchase window based on your product cycle. For monthly SaaS, a repeat purchase is a renewal. For e-commerce, set a window (90 days, 180 days) that matches your category's buying frequency
2. Build a loyalty program that rewards repeat behavior. Even simple tier systems (Bronze/Silver/Gold based on purchase count) increase repeat rates by 15-25% in our experience
3. Set up automated re-engagement sequences. Email customers who haven't purchased within 75% of their typical buying cycle with personalized recommendations
4. Collect post-purchase feedback to identify friction. Customers who had a negative experience but didn't complain rarely come back. Proactive outreach surfaces issues before they become permanent churn
5. Track repeat rate by acquisition channel. You might find that referral customers have a 60% repeat rate while paid social customers sit at 20%. That should inform your acquisition strategy
10. Cart Abandonment Rate: Recovering Lost Revenue
Cart abandonment rate measures the percentage of users who add items to their cart (or start a checkout process) but leave without completing the purchase. For SaaS, the equivalent is trial-to-paid abandonment or signup flow drop-off.
The formula: Abandonment Rate = (Carts Created - Purchases Completed) / Carts Created x 100
According to cart abandonment statistics, the average cart abandonment rate sits around 71.82%. That means roughly seven out of ten people who express purchase intent walk away. Even a 5% recovery improvement translates to significant revenue.
Steps to track and recover this:
1. Audit your checkout flow for unnecessary steps. Each additional form field or page in the checkout process increases abandonment by 7-10%. Aim for a single-page checkout where possible
2. Deploy exit-intent popups that trigger when a user moves to close the tab during checkout. Offer a specific incentive: free shipping, a 10% discount code, or a limited-time bonus
3. Set up a three-email abandonment recovery sequence: send the first email within one hour (reminder only), the second at 24 hours (add social proof), and the third at 72 hours (include incentive)
4. Show trust signals at checkout: security badges, money-back guarantees, and customer testimonials. These reduce anxiety-driven abandonment
5. Offer guest checkout. Forced account creation before purchase is one of the top three abandonment causes across industries
An exit-intent popup with a free shipping offer designed to recover abandoning visitors
11. Customer Lifetime Value (CLV): The North Star Metric
Customer lifetime value projects the total revenue a single customer will generate across their entire relationship with your business. It's the metric that connects acquisition (how much can we afford to spend?) with retention (how much is keeping this customer worth?) into one number.
The formula: CLV = Average Purchase Value x Average Purchase Frequency x Average Customer Lifespan
For SaaS, this simplifies to: CLV = Average Monthly Revenue Per Customer x Average Customer Lifespan in Months
CLV matters because it sets the upper bound for what you should spend on acquisition. If your CLV is $3,000, a $1,000 CAC is sustainable. If your CLV is $500, that same CAC is a path to insolvency.
How to calculate and apply this:
1. Calculate CLV by cohort (month of acquisition), not as a blended average. Early cohorts might have different retention patterns than recent ones due to product changes
2. Track the CLV-to-CAC ratio. The benchmark for healthy SaaS is 3:1 or higher. Below 3:1, you're spending too aggressively on acquisition relative to what customers return
3. Identify your highest-CLV customer segment and reverse-engineer what makes them different. Is it their industry? Company size? Onboarding experience? Use those insights to build lookalike targeting for acquisition
4. Invest in retention proportionally. If increasing average customer lifespan by two months adds $200 to CLV, spending $50 on retention programs per customer is an obvious win
5. Include expansion revenue in CLV calculations. Upsells, cross-sells, and plan upgrades are part of lifetime value and often represent 20-40% of total CLV for SaaS products
According to Glueup's sales funnel benchmarks, B2B and membership-driven models see overall funnel conversion rates between 3% and 5%. With such selective funnels, every retained customer carries outsized value.
12. Return on Investment (ROI): Proving Marketing and Sales Impact
ROI measures the net profitability of a specific investment, campaign, or channel. It's the executive-facing metric that answers "was this worth the money?" for every dollar spent on marketing and sales activities.
The formula: ROI = (Net Profit from Investment / Cost of Investment) x 100
Where Net Profit = Revenue Generated - Cost of Investment.
An ROI of 300% means you earned $3 for every $1 spent. An ROI of -20% means you lost money. The challenge with marketing ROI is attribution: accurately connecting revenue to the campaigns and channels that generated it.
How to measure this per channel:
1. Calculate ROI per channel, not just blended. Your email marketing might return 4,200% while display ads return 80%. Blending hides where value actually comes from
2. Use multi-touch attribution rather than last-click. A customer who read three blog posts, attended a webinar, and then clicked a retargeting ad shouldn't credit 100% of revenue to the ad
3. Include time as a variable. A campaign that produces $10K in revenue over 30 days has better velocity-adjusted ROI than one producing $12K over 180 days
4. Track marketing-influenced pipeline alongside marketing-sourced pipeline. The blog post that didn't source the lead but influenced the $50K deal still deserves credit
5. Review ROI quarterly and reallocate. Shift 10-20% of budget from your lowest ROI channels to your highest each quarter. This compounding reallocation improves overall marketing ROI by 15-25% annually
13. Churn Rate: The Retention Metric That Affects Everything
Churn rate measures the percentage of customers who stop using your product or cancel their subscription within a given period. For SaaS, it's the metric that makes or breaks unit economics. High churn forces you to constantly backfill lost revenue through new acquisition, creating an expensive treadmill that never produces net growth.
The formula: Churn Rate = (Customers Lost During Period / Customers at Start of Period) x 100
The ideal churn rate is zero, but that's unrealistic. What matters is how yours compares to industry benchmarks and whether the trend line is moving in the right direction.
How to track and reduce this:
1. Measure both logo churn (customer count) and revenue churn (MRR lost) separately. Losing ten $50/month customers is different from losing one $500/month customer, even though logo churn is the same
2. Track net revenue churn, which accounts for expansion revenue. If you lost $5K in MRR from churned customers but gained $7K from upsells, your net revenue churn is -2% (negative churn, which is the gold standard)
3. Build a churn prediction model using engagement score, support ticket frequency, login recency, and feature adoption as inputs. Intervene with at-risk accounts before they cancel
4. Conduct exit interviews or surveys for every churning customer. Categorize reasons (price, missing features, competitor switch, went out of business) and address the top two causes specifically
5. Implement a "save flow" for cancellation. Offer a pause option, a temporary discount, or a plan downgrade before accepting the cancellation. These flows recover 10-20% of attempted cancellations in our experience
According to Venturz's sales funnel data, the average conversion rate across all industries stands at approximately 2.35%. When you pair that low top-of-funnel conversion with high churn, the math becomes brutal: you need to acquire far more customers than you retain. Reducing monthly churn by even 1 percentage point compounds significantly. For a SaaS company with 1,000 customers, dropping churn from 5% to 4% means retaining 120 additional customers per year, which at $100 MRR each represents $144K in preserved annual revenue.
Which Funnel Metrics Should You Start With
Tracking all 13 funnel metrics at once overwhelms most teams. Start with the metrics that match your current growth bottleneck, then layer in additional tracking as your analytics maturity increases.
| Priority | Metric | Effort | Impact | Best For |
|---|---|---|---|---|
| 1 | Conversion Rate | Low | High | Any team with basic analytics in place |
| 2 | Churn Rate | Low | High | SaaS teams losing customers faster than they acquire |
| 3 | CAC | Medium | High | Teams spending on paid channels without ROI clarity |
| 4 | CLV | Medium | High | Companies ready to connect acquisition to retention |
| 5 | Cart Abandonment Rate | Low | Medium | E-commerce and trial-based SaaS |
| 6 | Number of Leads | Low | Medium | Teams building pipeline visibility |
| 7 | Sales Velocity | Medium | Medium | B2B teams with CRM data and defined pipeline stages |
| 8 | Average Deal Size | Low | Medium | Sales teams working to increase revenue per close |
| 9 | ROI | High | High | Marketing teams justifying budget to executives |
| 10 | AOV | Low | Medium | E-commerce and transactional SaaS |
| 11 | CSAT | Medium | Medium | Teams with active customer support operations |
| 12 | Customer Engagement Score | High | High | Product-led growth companies with usage analytics |
| 13 | Repeat Purchase Rate | Medium | Medium | Companies with repeat buying cycles |
Start with Conversion Rate and Churn Rate because they require minimal setup and expose the biggest leaks in your funnel. Once those are stable, add CAC and CLV to build a complete unit economics picture. The remaining metrics layer in based on your business model and growth stage.
Start With Two Funnel Metrics, Then Build From There
Seven actionable tips to optimize your marketing and sales funnel
You don't need a dashboard with all 13 funnel metrics to start seeing results. Pick the two metrics that map to your biggest current problem. Losing customers? Track churn rate and CSAT. Can't grow fast enough? Focus on conversion rate and CAC. Revenue too low per customer? Measure AOV and CLV.
The data you need is probably already sitting in your analytics and CRM tools. The work is in defining what each metric means for your specific business, setting a baseline, and reviewing it consistently.
If lead generation is your bottleneck, start by examining where your highest-quality leads come from. Tools like quiz funnels and website promotion strategies can feed your top of funnel while you optimize the stages below.
Set a 90-day review cycle. Measure your baseline now, implement one change per metric, and compare results at the end of the quarter. That cadence gives you enough data for statistical confidence without slowing down execution.
Frequently Asked Questions
What are the key metrics of a funnel?
The most important funnel metrics depend on your business model, but five are universal: conversion rate (effectiveness at each stage), CAC (acquisition efficiency), CLV (long-term customer value), churn rate (retention health), and sales velocity (pipeline speed). For e-commerce businesses, add cart abandonment rate and AOV. For SaaS, add customer engagement score and repeat purchase rate. Start with the metrics that address your current biggest growth bottleneck rather than tracking everything simultaneously.
What is a KPI funnel?
A KPI funnel is a framework that assigns specific key performance indicators to each stage of your conversion funnel. At the top (awareness), you track impressions and lead volume. In the middle (consideration), you monitor conversion rate and engagement score. At the bottom (decision), you focus on deal size, win rate, and CAC. Post-purchase KPIs include CLV, CSAT, and churn rate. The funnel structure ensures every metric has context within the customer journey rather than existing in isolation.
How do you measure funnel metrics effectively?
Start with a conversion rate calculator and web analytics tools like Google Analytics 4 for traffic and conversion data. Connect your CRM (HubSpot, Salesforce) for pipeline metrics like sales velocity and deal size. Use customer success platforms for engagement scoring and churn prediction. The key to effective measurement isn't the tools; it's consistency. Define your metrics once, automate data collection, and review dashboards weekly. According to Funnel.io's 2026 report, 72% of marketers struggle to turn data into actionable insight, usually because they track too many metrics without a clear framework for decision-making.
What are examples of funnel metrics in SaaS?
SaaS-specific funnel metrics include: trial-to-paid conversion rate (typically 2-5% for freemium, 15-25% for free trial), monthly recurring revenue (MRR) growth rate, expansion revenue rate (upsells and cross-sells as a percentage of total MRR), net revenue retention (target 110%+ for healthy SaaS), time to first value (how quickly new users reach their "aha moment"), and product-qualified lead (PQL) rate. These metrics reflect SaaS-specific dynamics like recurring revenue, product-led growth, and the importance of retention over one-time sales.
Why should you track funnel metrics for business growth?
Tracking funnel metrics reveals the specific points where your revenue engine breaks down. Without metrics, growth strategies are guesswork. With them, you can calculate exactly how much a 5% conversion rate improvement at stage three would add to annual revenue, then build a business case for the investment needed. Funnel metrics also create accountability across teams: marketing owns top-of-funnel numbers, sales owns mid-funnel, and customer success owns post-purchase metrics. This shared measurement framework aligns everyone toward the same revenue goals and eliminates the finger-pointing that happens when teams operate in silos.

How would you rate your experience with this article? 😊